
Do you want to learn to measure and analyse everything that happens on your website? Do you want to know where your visits come from, how your users behave on your site and what you actually get from your traffic? In this Google Analytics tutorial, I explain step-by-step how to take advantage of this great free web analytics tool so you don't miss anything.
What is Google Analytics and what is it for?
Google Analytics is a free web analytics tool that offers a wide variety of options to analyse your website traffic and its performance.
Analysing what users do when they reach your website is essential because you want to know they are taking the correct actions. The good thing about the internet is that everything can be measured, and by measuring/analysing properly, you can act accordingly to ensure you improve.
Although from time to time, Analytics changes its interface, modifies names of functionality and introduces new functions that you have to get used to, in general it is a very simple and intuitive tool, so it is perfectly suitable for beginners.
Their reports are very complete and visual and all the information is very well organised so that you can access what interests you from its menu on the left sidebar.
Should I use Google Analytics if I have a website?
Definitely yes. Analysing your traffic is essential and Google Analytics is a very complete tool. As if that were not enough, it is free and comes from Google itself (remember Google has a lot of information and if you have access to some of its insights, then it shouldn't really be ignored)
Among many other things, with Analytics you will know:
- Who the users of your website are (audience)
- Where you are getting visits to your website from (traffic sources)
- How your users behave on your website (what pages they visit, where they enter, where they leave, etc.)
- What actions you are getting on your traffic (conversions on your website)
Basic concepts of web analytics
Before talking about Google Analytics, if you are not familiar with web analytics in general, there are a number of basic concepts that you should be clear about, in order that you know how to correctly interpret the many pieces of data offered by the Google Analytics tool:
- Active users: a while ago they were called unique visitors, now they are called active users (and may be something completely different in the future). Active users are the people who access your website. The same user can perform several sessions (visits).
- Sessions: are the total visits recorded on your website in a certain period of time.
- Page Views: indicates the total pages that users have visited during their browsing sessions on your website.
- Unique Views Pages: represents the number of sessions in which a page has been viewed at least once.
- Bounce Rate: indicates the percentage of users who have left your website after visiting a single page.
- Organic traffic: indicates the traffic that reaches your website from search engines (Google, Bing, Yahoo, etc.).
- Social Traffic: indicates the traffic that reaches your website from social networks.
- Reference Traffic: the traffic that comes to you from other websites, through some sort of linked reference.
- Direct Traffic: the traffic you receive when users directly enter a URL in their browsers.
- Not Provided: these are the keywords that Google does not provide and that make up the vast majority of organic traffic.
- Objective: are the milestones or goals that you can configure to measure conversions on your website.
How to start using Google Analytics
First, create an account (if you don't have one) and register your website.
Create an account
First of all, you must have a Gmail Account, since when you create a Google Analytics account you will be asked to log in with your Gmail email. If you don't have a Google account, this is the time to create it.
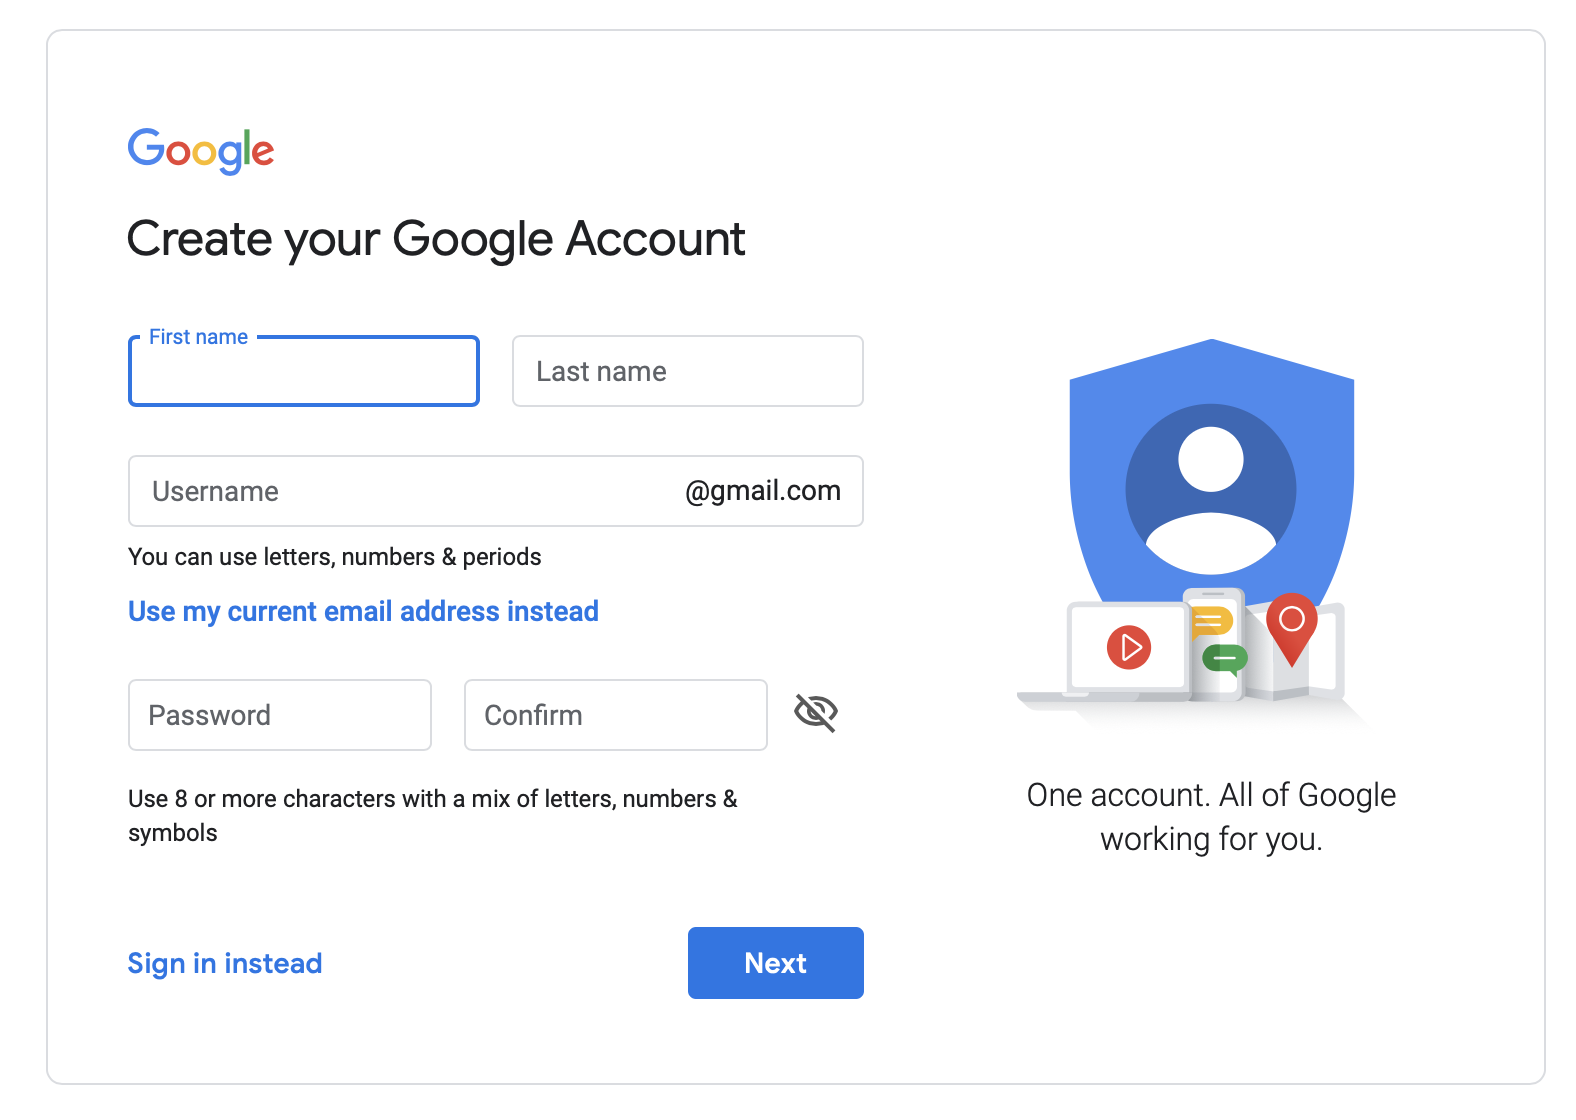
Once logged in with your Google account, you can sign up for Analytics and register your website.
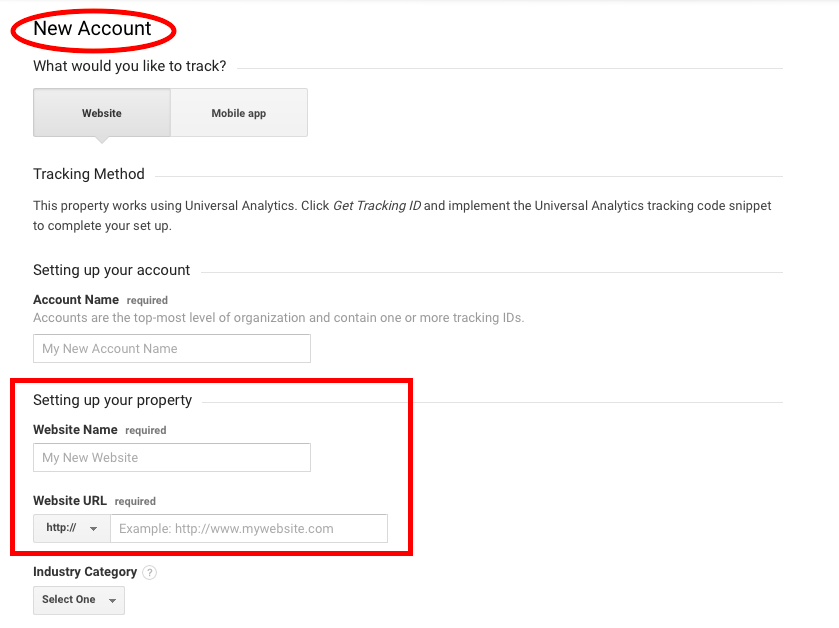
Next, you must fill in the information requested to register your website.
Then click 'Get Tracking ID' button.
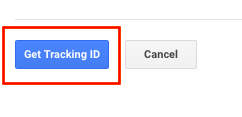
That tracking code is what you should insert into your website so that Analytics can start collecting data from your traffic.
Insert tracking code
There are different ways in which you can insert the Google Analytics tracking code into your website. And it will also depend on whether you use WordPress, Blogger, Magento, Prestashop, Joombla, your own code, etc.
Here is an article on how to install your Analytics ID on your website that may be useful.
Customisation
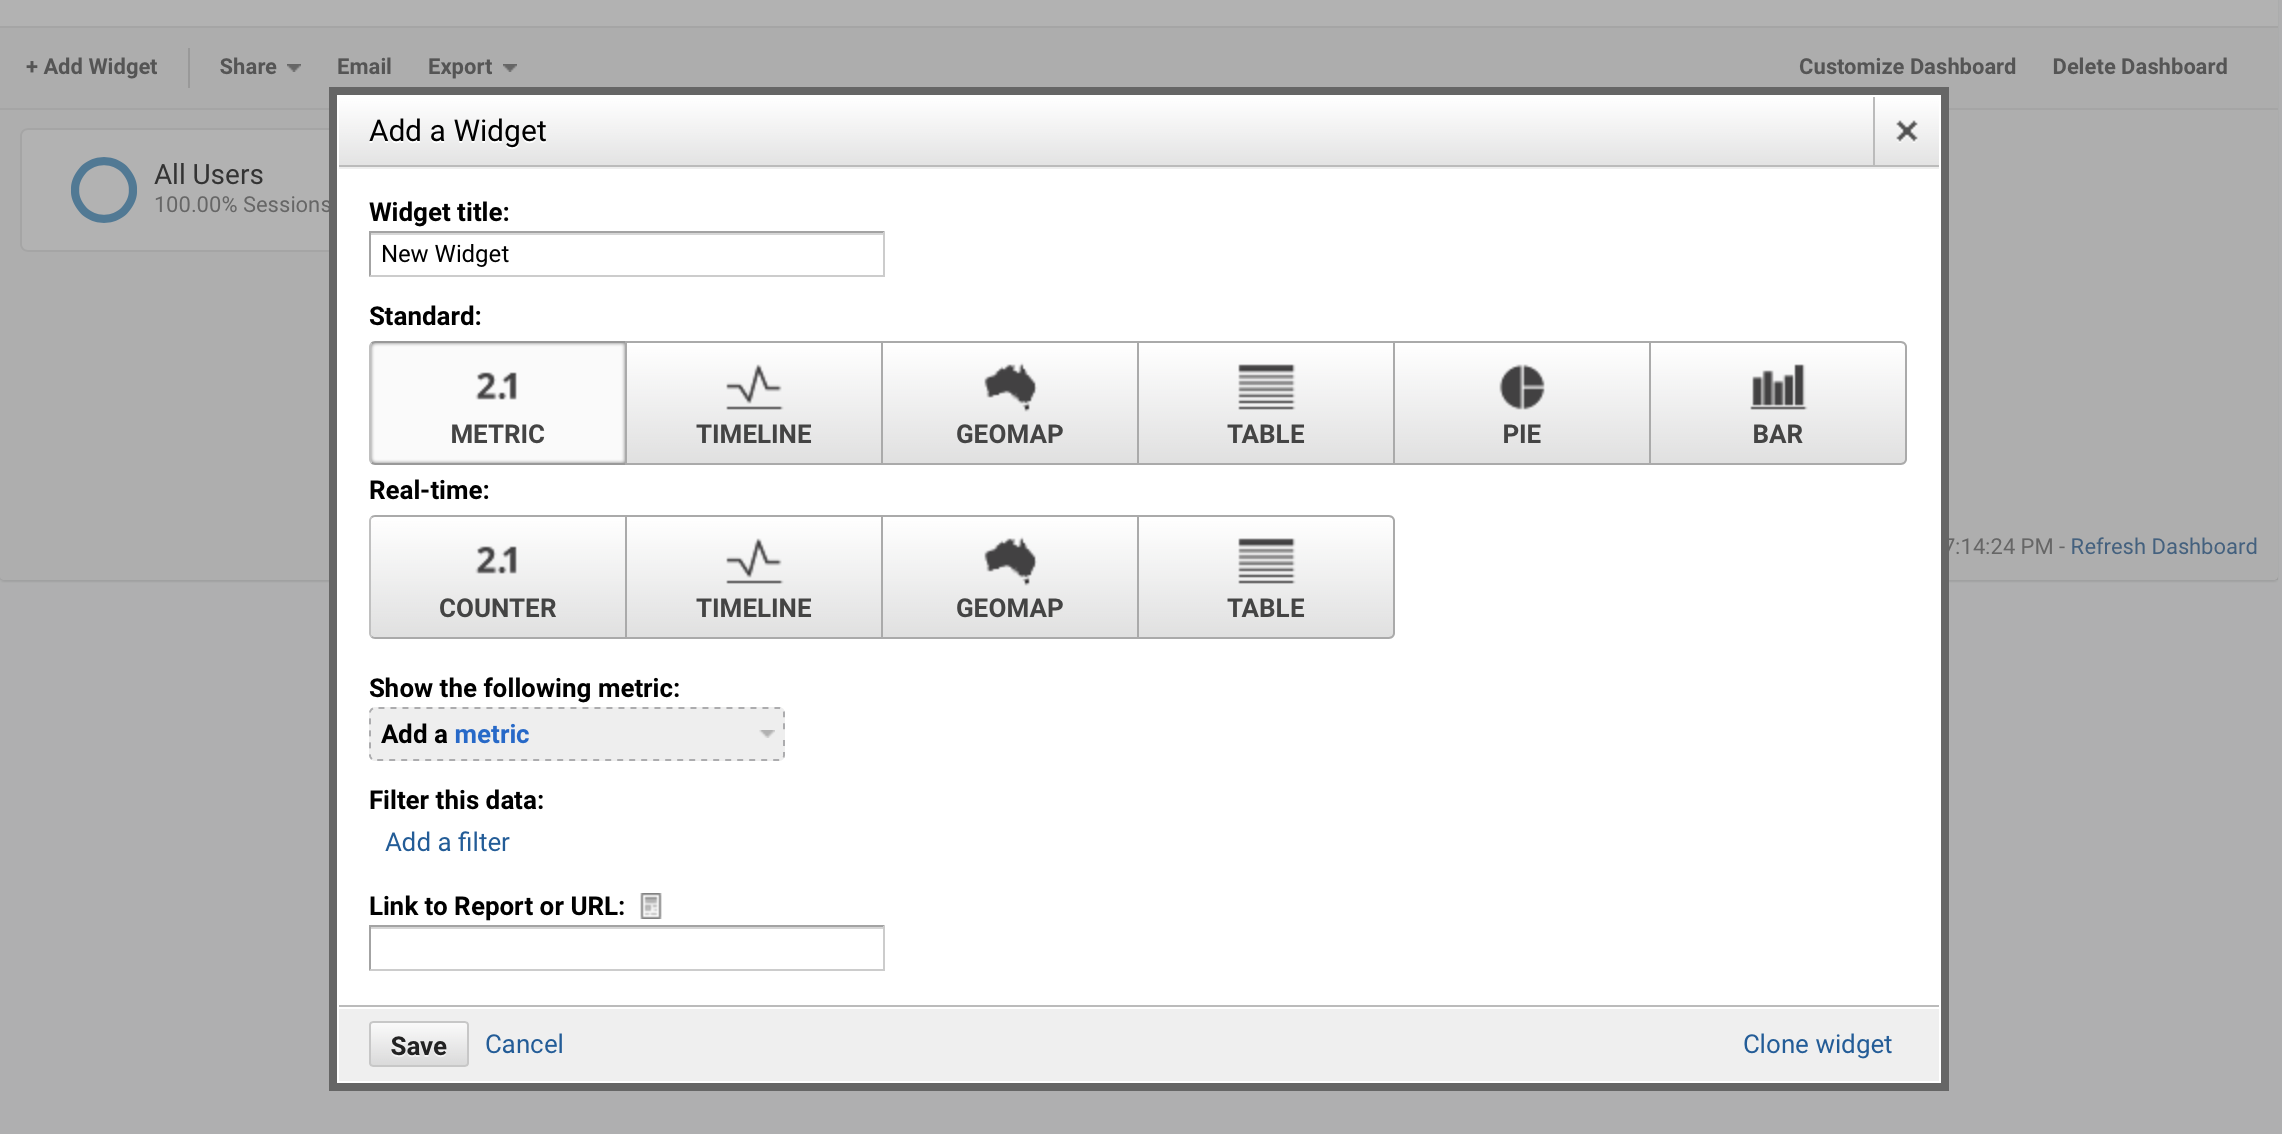
Throughout this Google Analytics guide, we will cover all the relevant sections, types of reports, and breakdown of traffic data. However, you may also be interested to know that you aren't limited by what Google Analytics already presents you; you can customise your own panels and reports, and create shortcuts to the information most relevant to you.
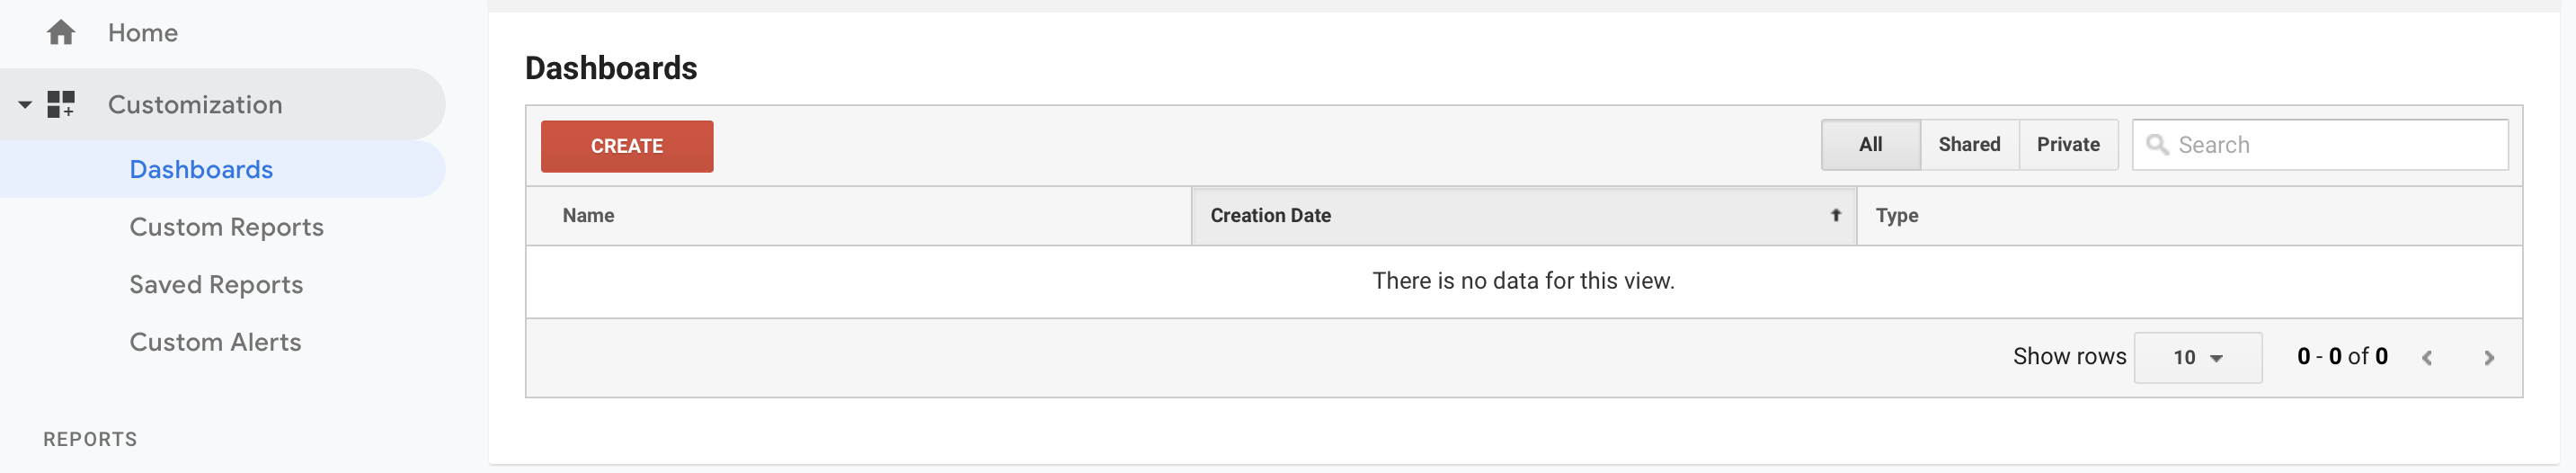
That is, if you are very clear that you want to obtain the data of something very specific, you can customise your panels and reports to show that specific information.
Real Time Reports
If you don't have a certain volume of visits, you probably won't see much information in this report.
But if you have a website with constant traffic, you are able to use this section to watch the number of users in real time looking at your site, what pages they are visiting, from what geographical areas they are from, and what devices they are using, etc.
Overview
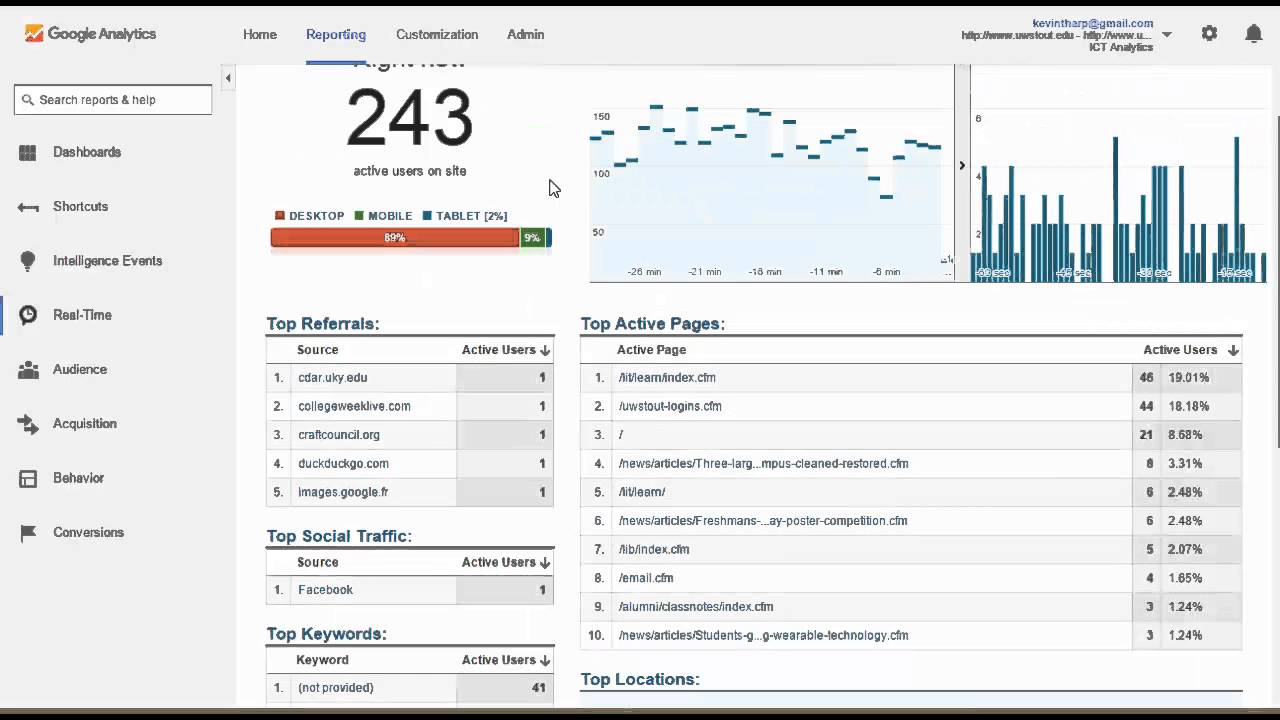
So, in this section, we access the general information of what is happening on our website in real time. The report is very visual, showing:
- Number of active users in real time
- Types of devices from which these users are accessing the website
- Page views per minute ... and per second!
- Main sources of social traffic
- Main keywords used for which we are having real-time traffic
- Main active pages (with real-time visits)
- Map of user locations
Locations
Here we can see data of the locations of active users on your website in real time.
We can see all the countries from which visitors are coming from, the number of visits from each country and the percentage they represent over the total.
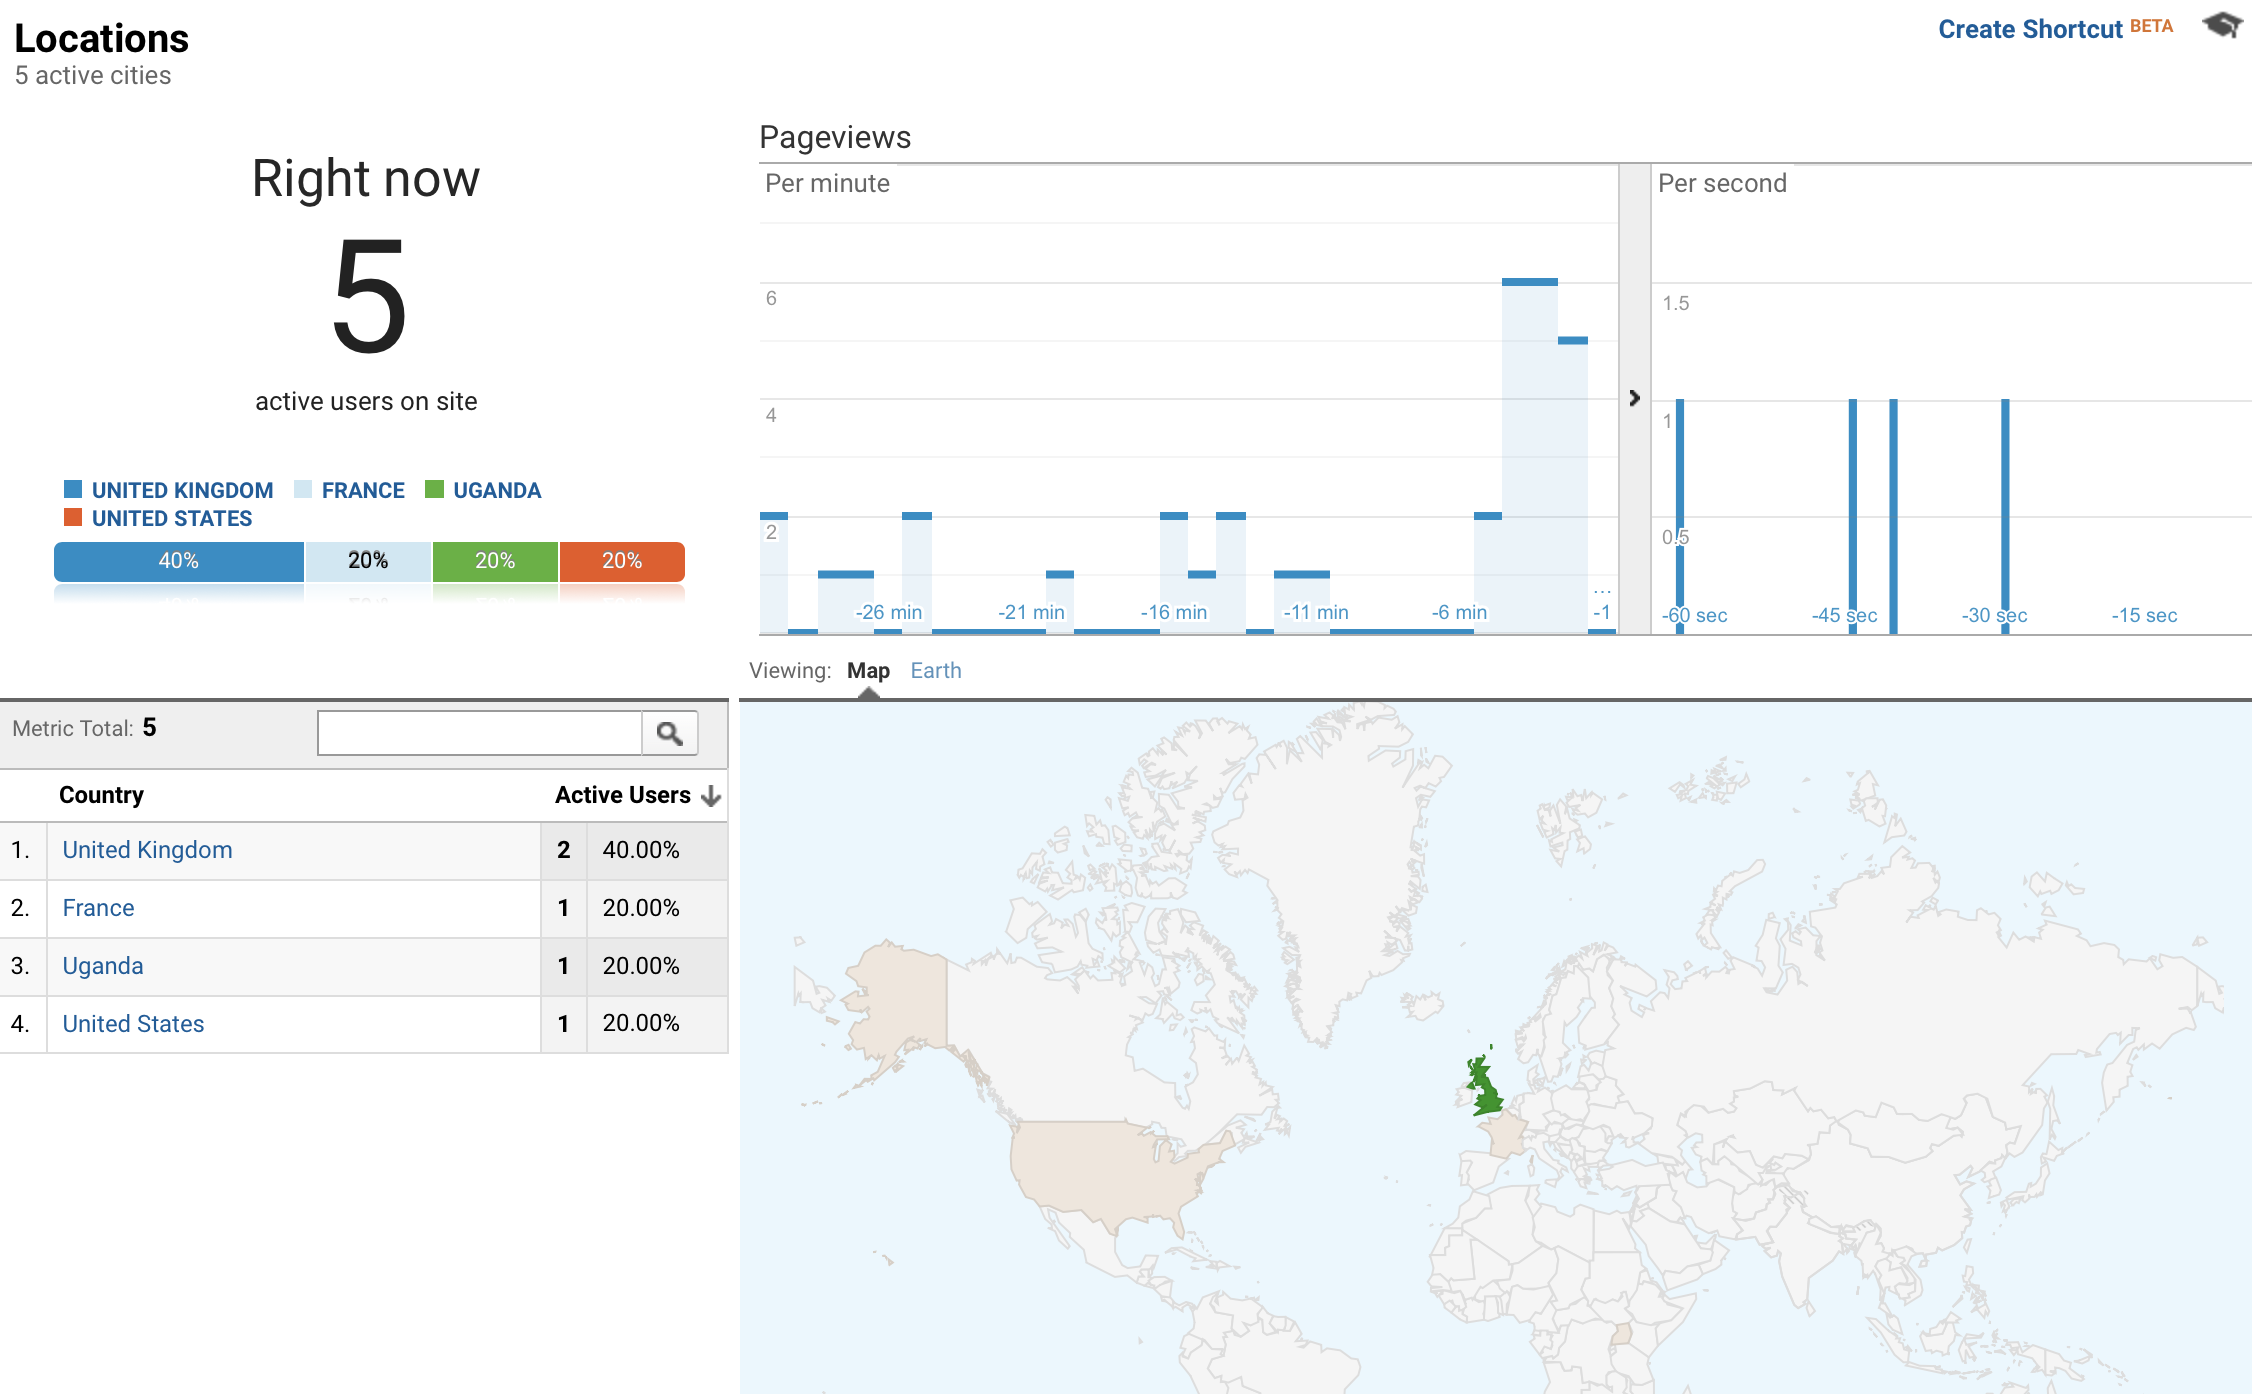
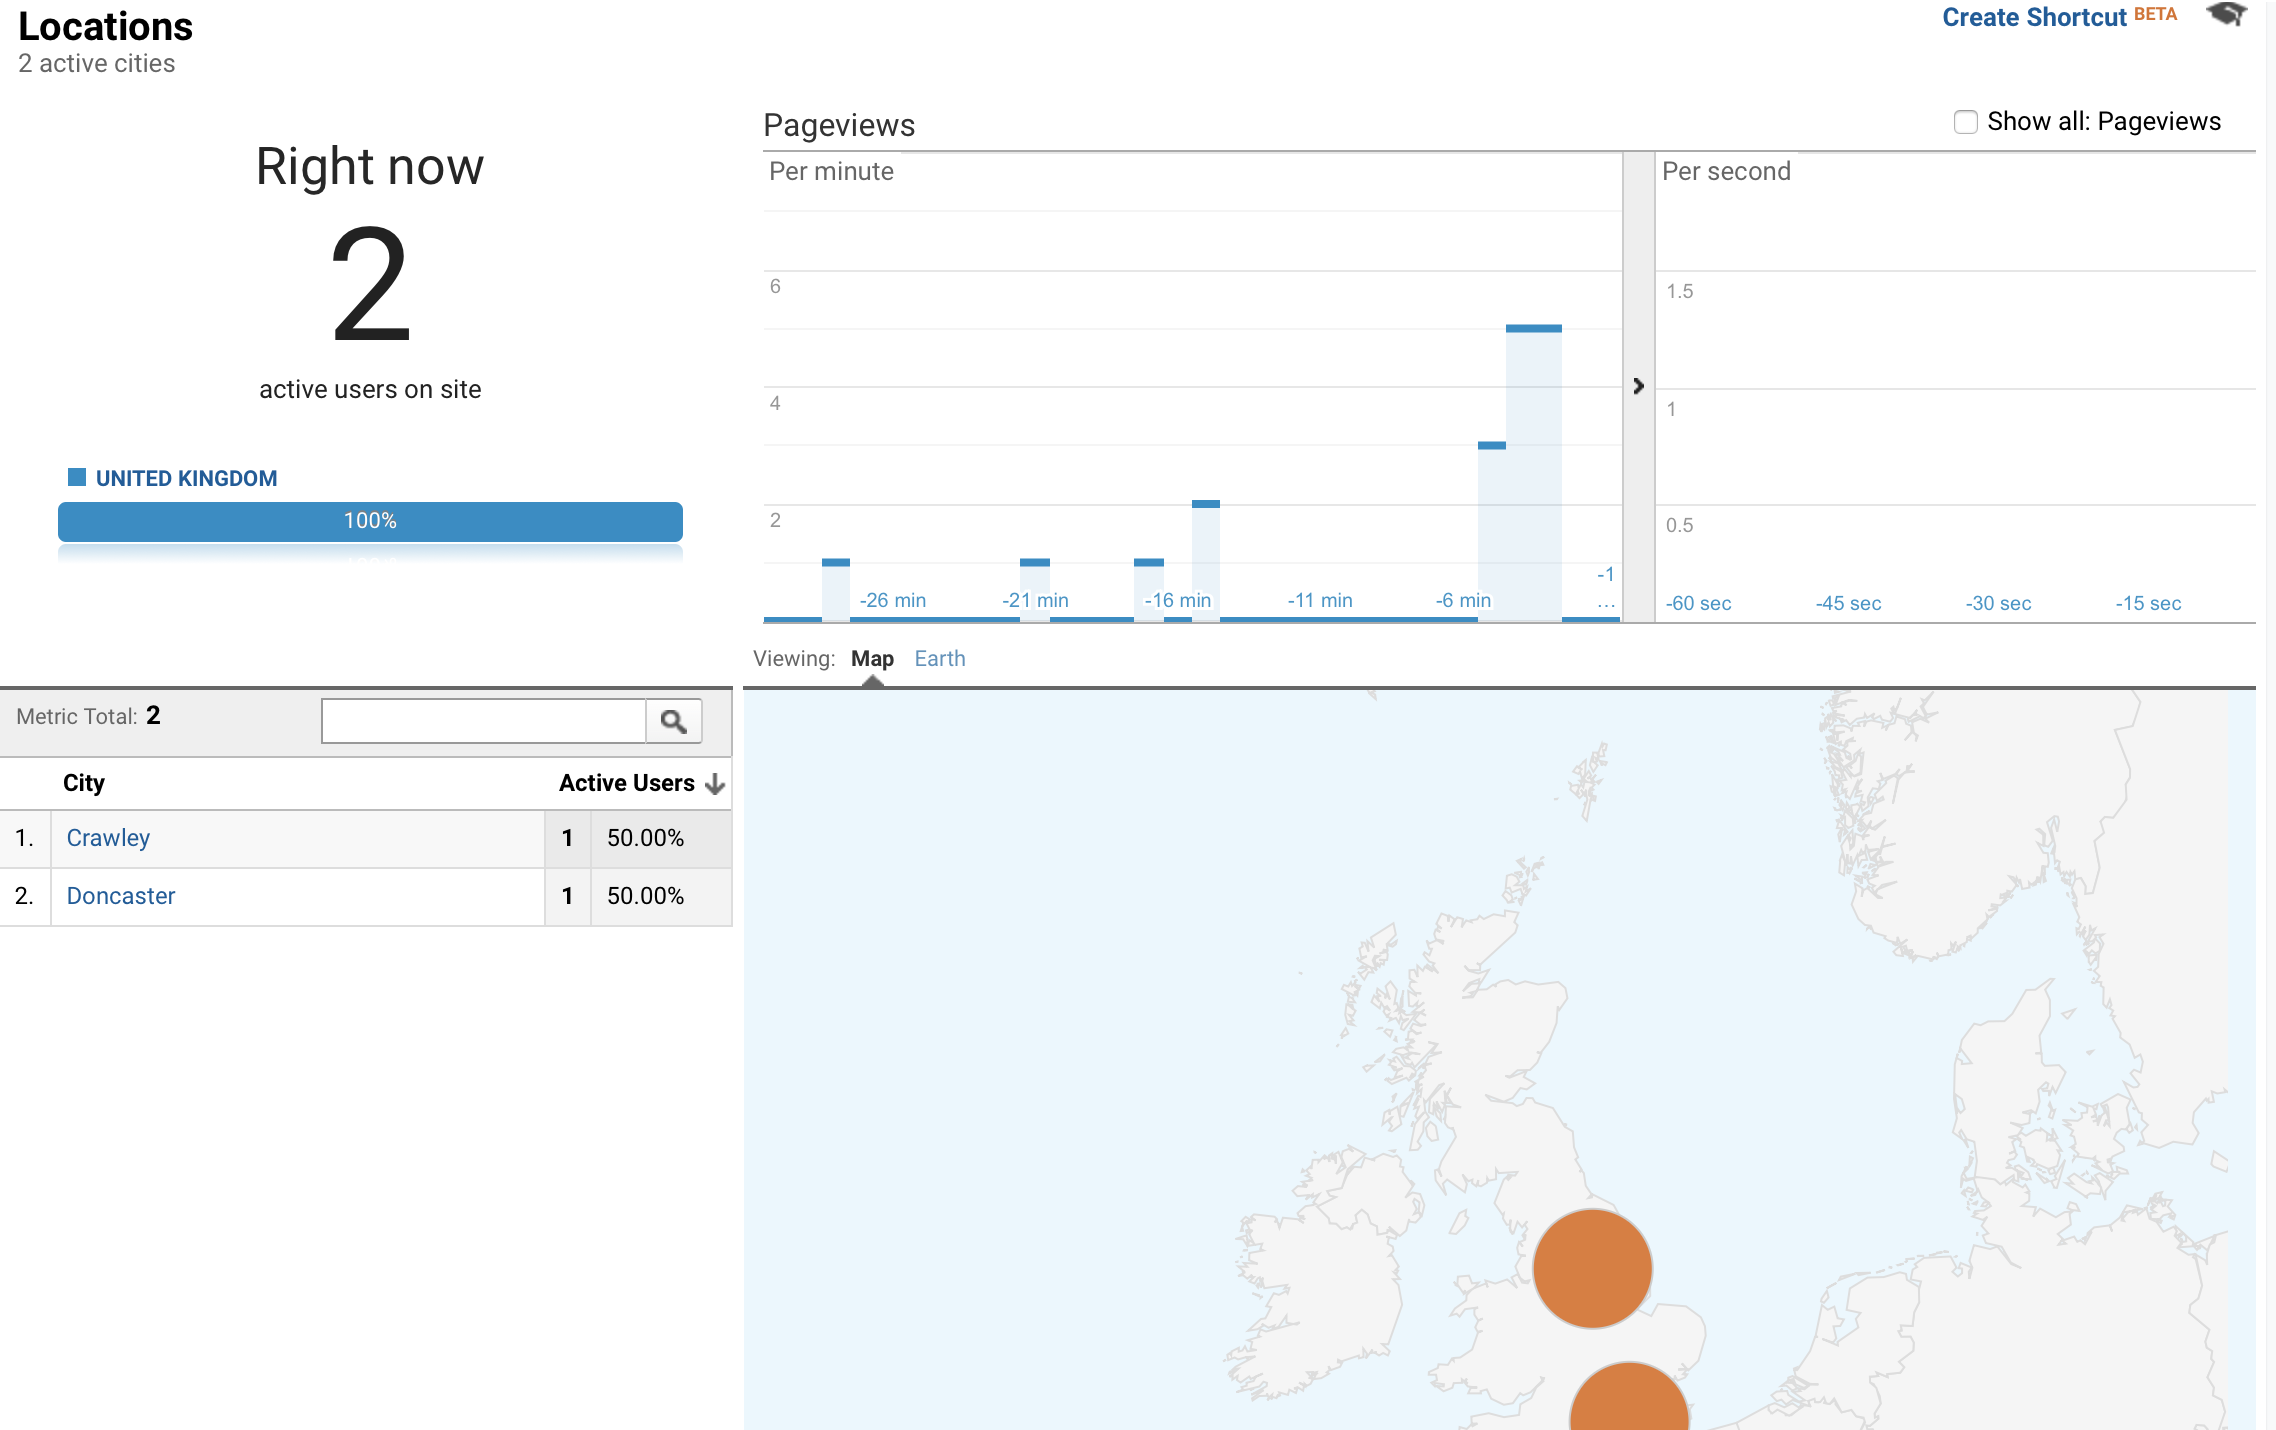
By clicking on one of the countries, you can get even more data about the particular regions.
Traffic Sources
Next, we are able to see the traffic sources that these users are coming from, in real time: organic, reference, social, direct.
The tool specifies the exact number of visits that are coming to us from each channel and specifies those that come from Google, Bing or Yahoo, Facebook or Pinterest, etc.
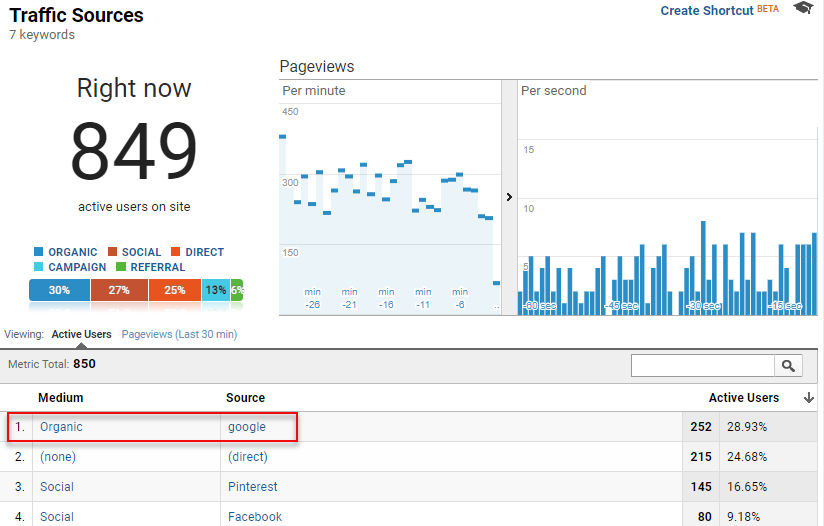
By clicking on any of these traffic sources, we are able to filter the data further. For example, if we select 'organic' traffic, it will show data about the search engine they used to find you (e.g. Google, Bing, Yahoo, etc.) and the keywords the user searched for to find your page. Unfortunately, here we will find many visits coming from 'not provided' keywords, as Google has increased the amount of privacy coming from user searches in recent years.
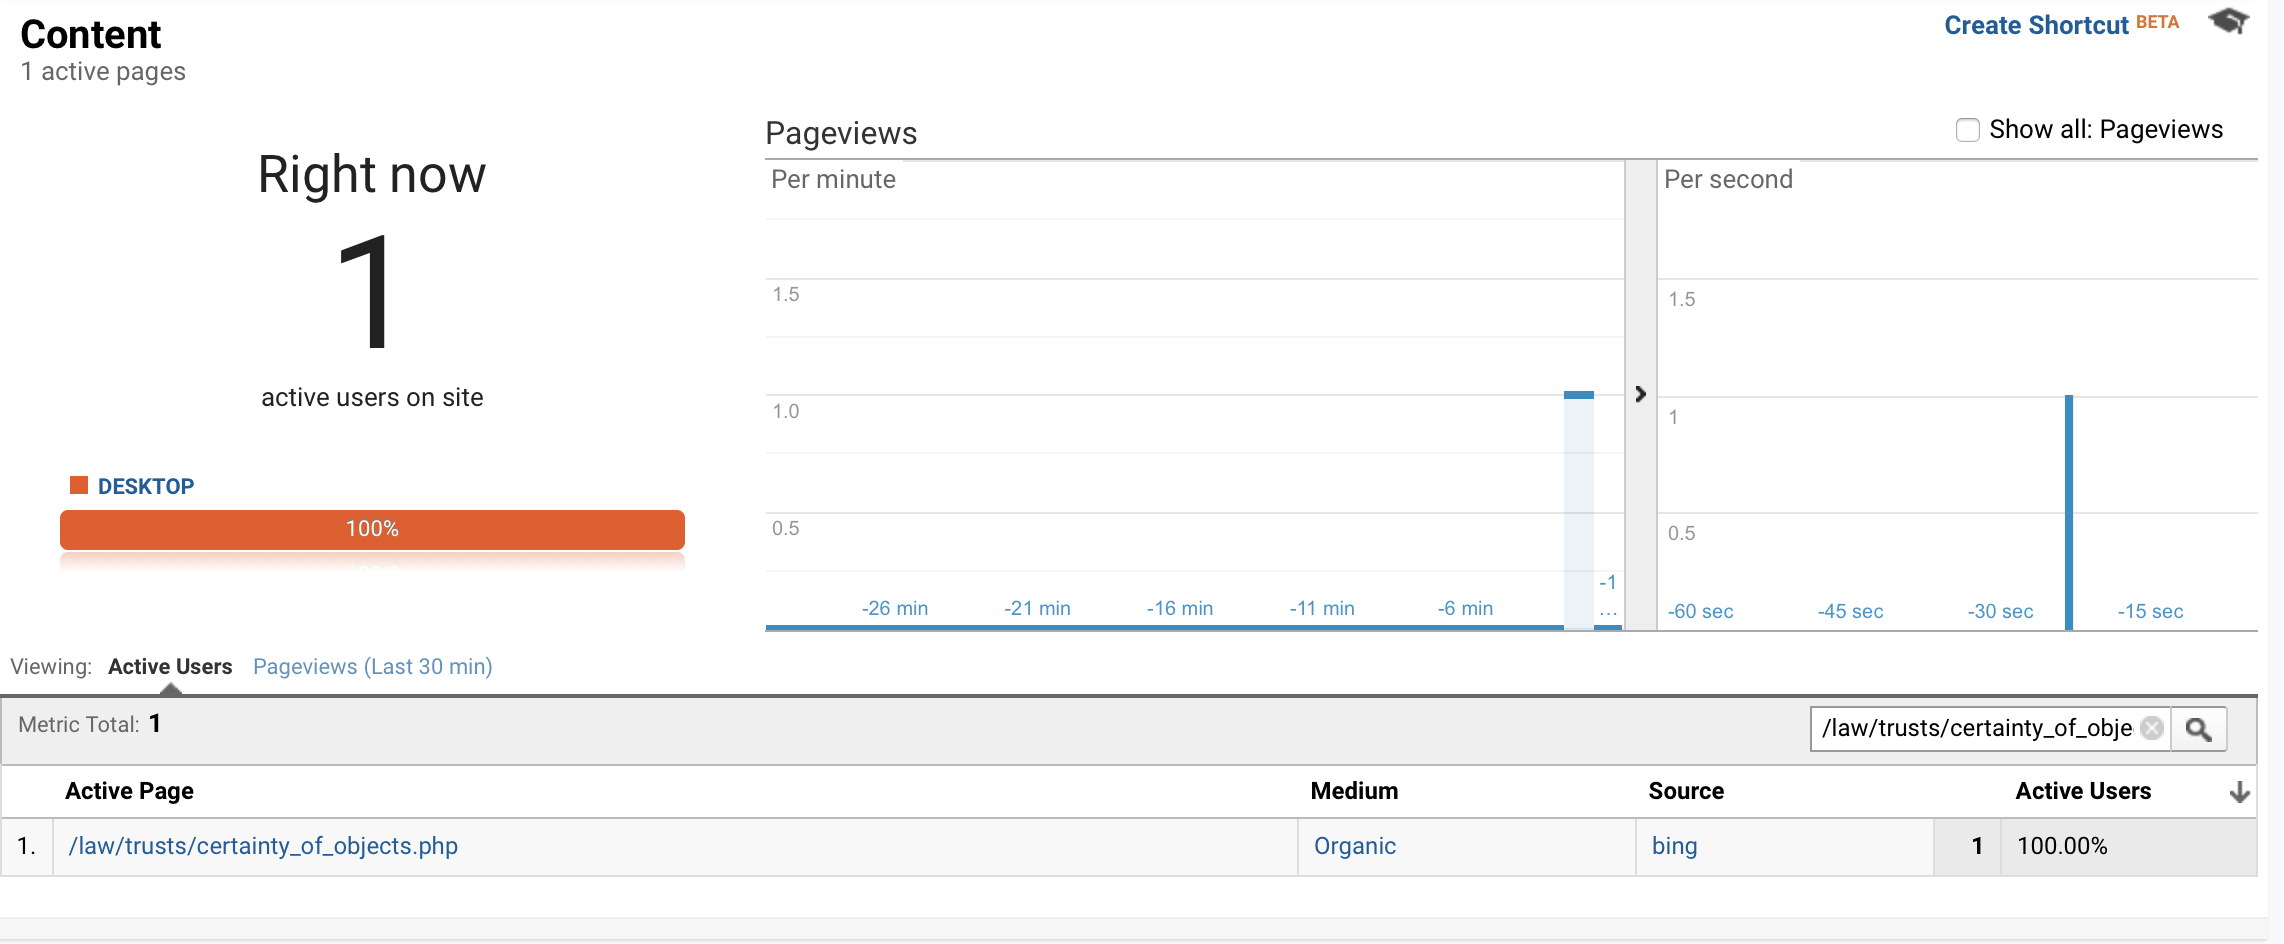
Content
Do you want to know exactly what pages these active users are visiting on your website in real time? Google Analytics also gives us that information.
This section tells us how many pages we have active at that time and presents a list of those URLs, with the exact number of users who are browsing each of them in real time.
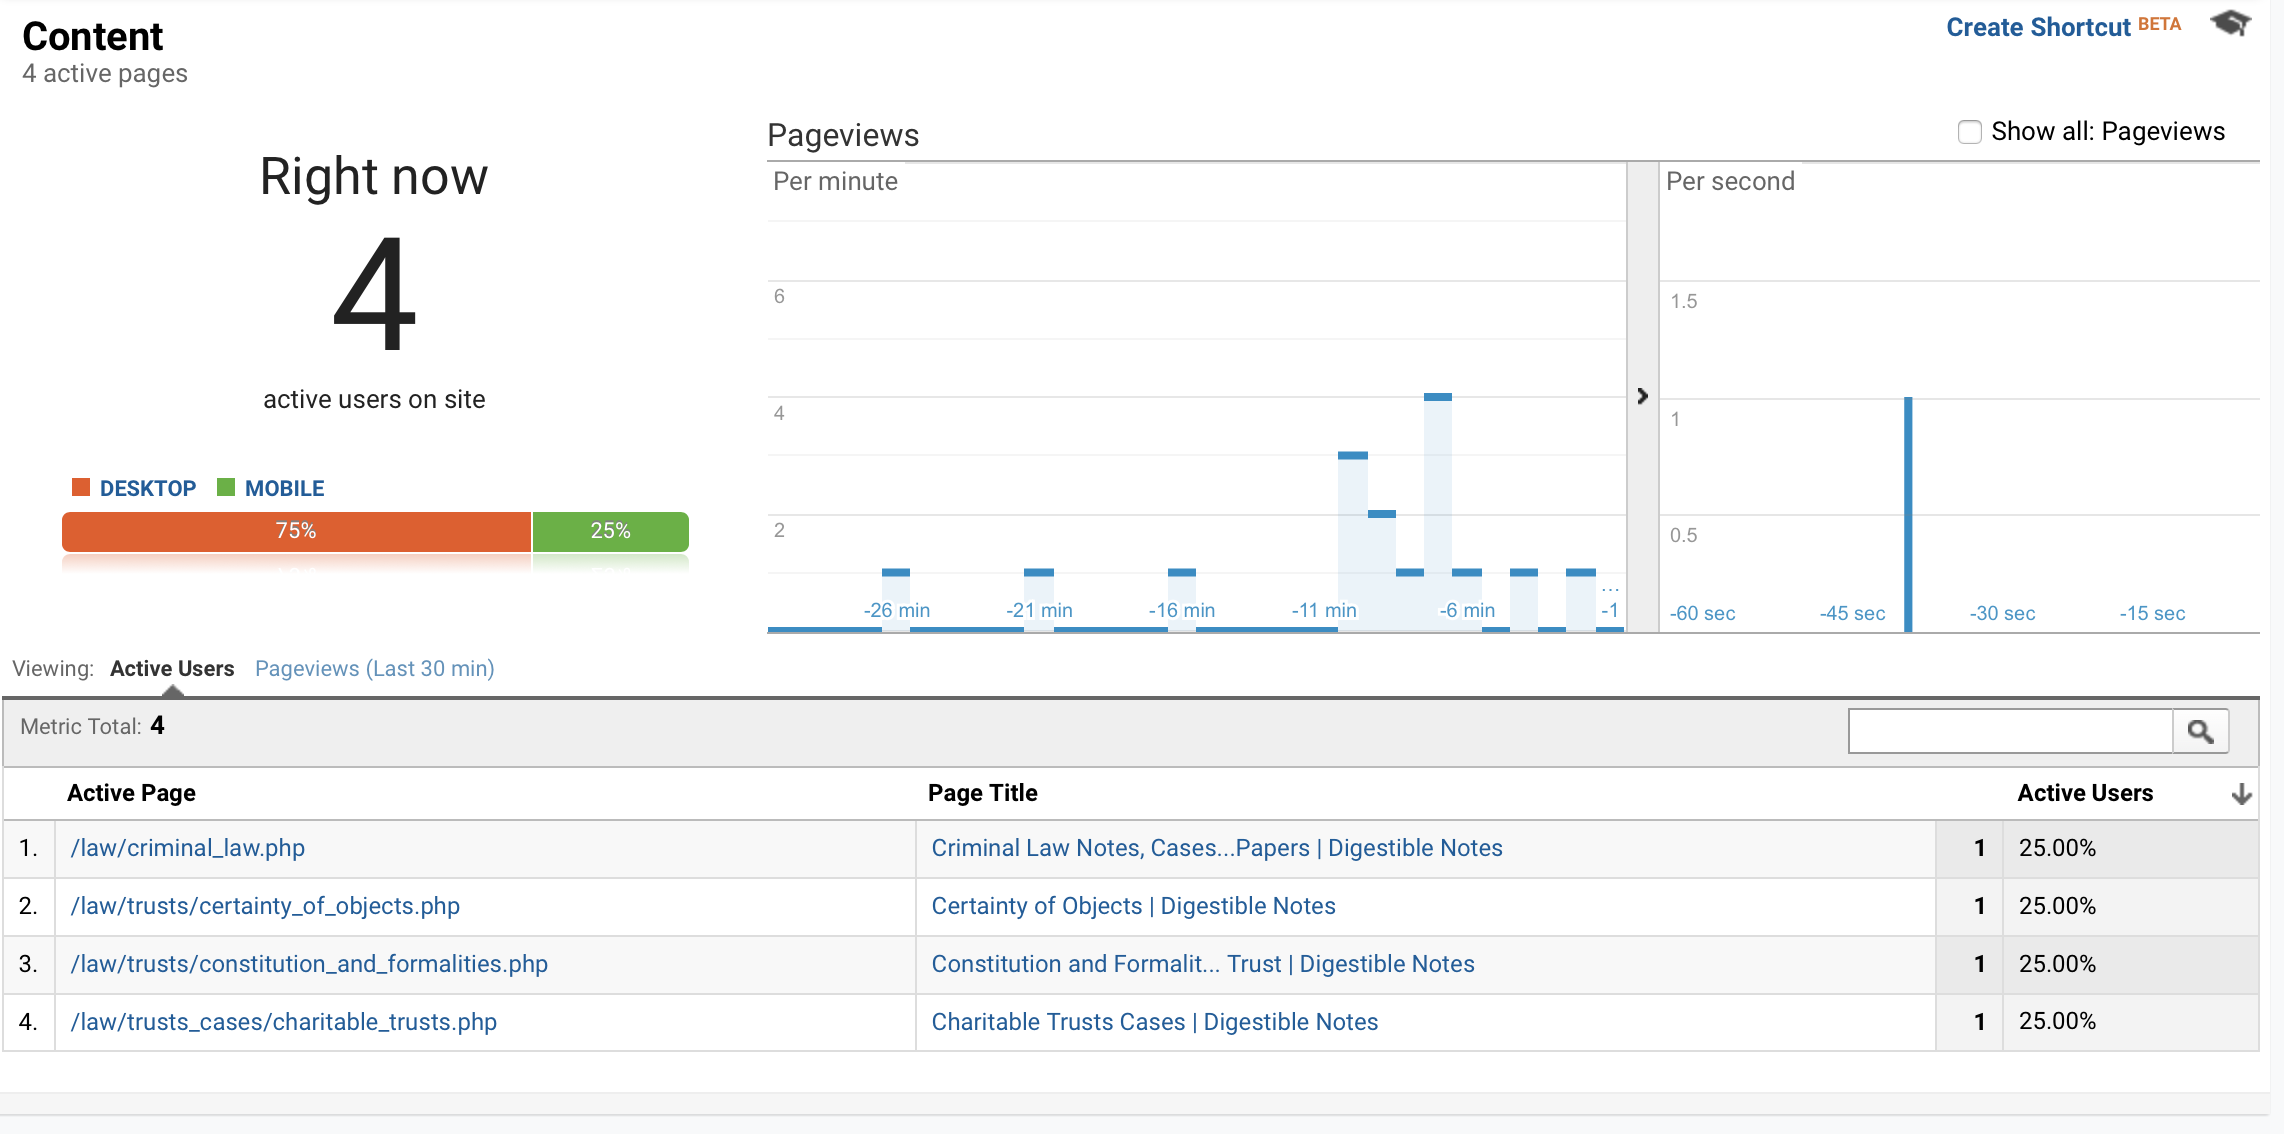
By clicking on any of these active page, we can filter the results and access the data of each page to know from what medium and source these visits are coming from. For example, the following active page is an organic search using Bing.
Events
If we have created some sort of event - for example “downloads of an ebook” - we can see in this section the data of the visits that have made to that event in real time.
Later in this guide we will talk about the creation of Events in Google Analytics.
Conversions
If we have set a goal (or several goals) - for example the number of registrations or subscriptions on our website - it will be in this section where we can see if we are meeting our goals in real time.
Later we will also see how goals work in Google Analytics and how they are setup.
Audience: Analyse who visits your website
Through the Audience section, we can analyse the users of our website and obtain very interesting data about them: ages, sex, devices they use, countries of origin, time spent on our website, the most popular pages, etc.
Through analysing all this information, we can more finely create content for our website and better communicate with our audience through the different channels we use.
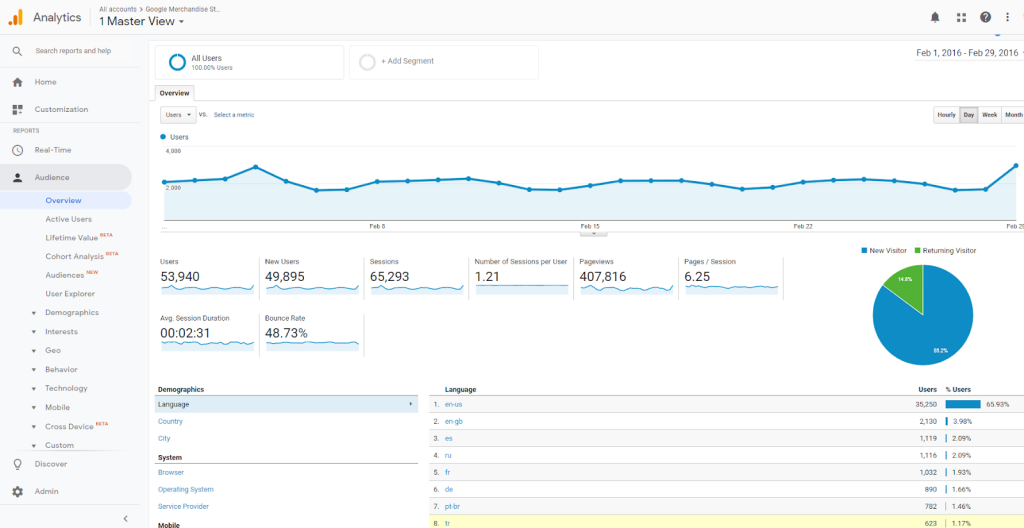
Overview
The 'overview' section provides us with various graphics displaying the general information about our users, which in sub-sections we can analyse in more detail:
- The number of users
- The number of sessions
- The number of page views
- The number of pages viewed per session
- The average duration of each session
- Bounce rate
- The percentage of new and recurring users
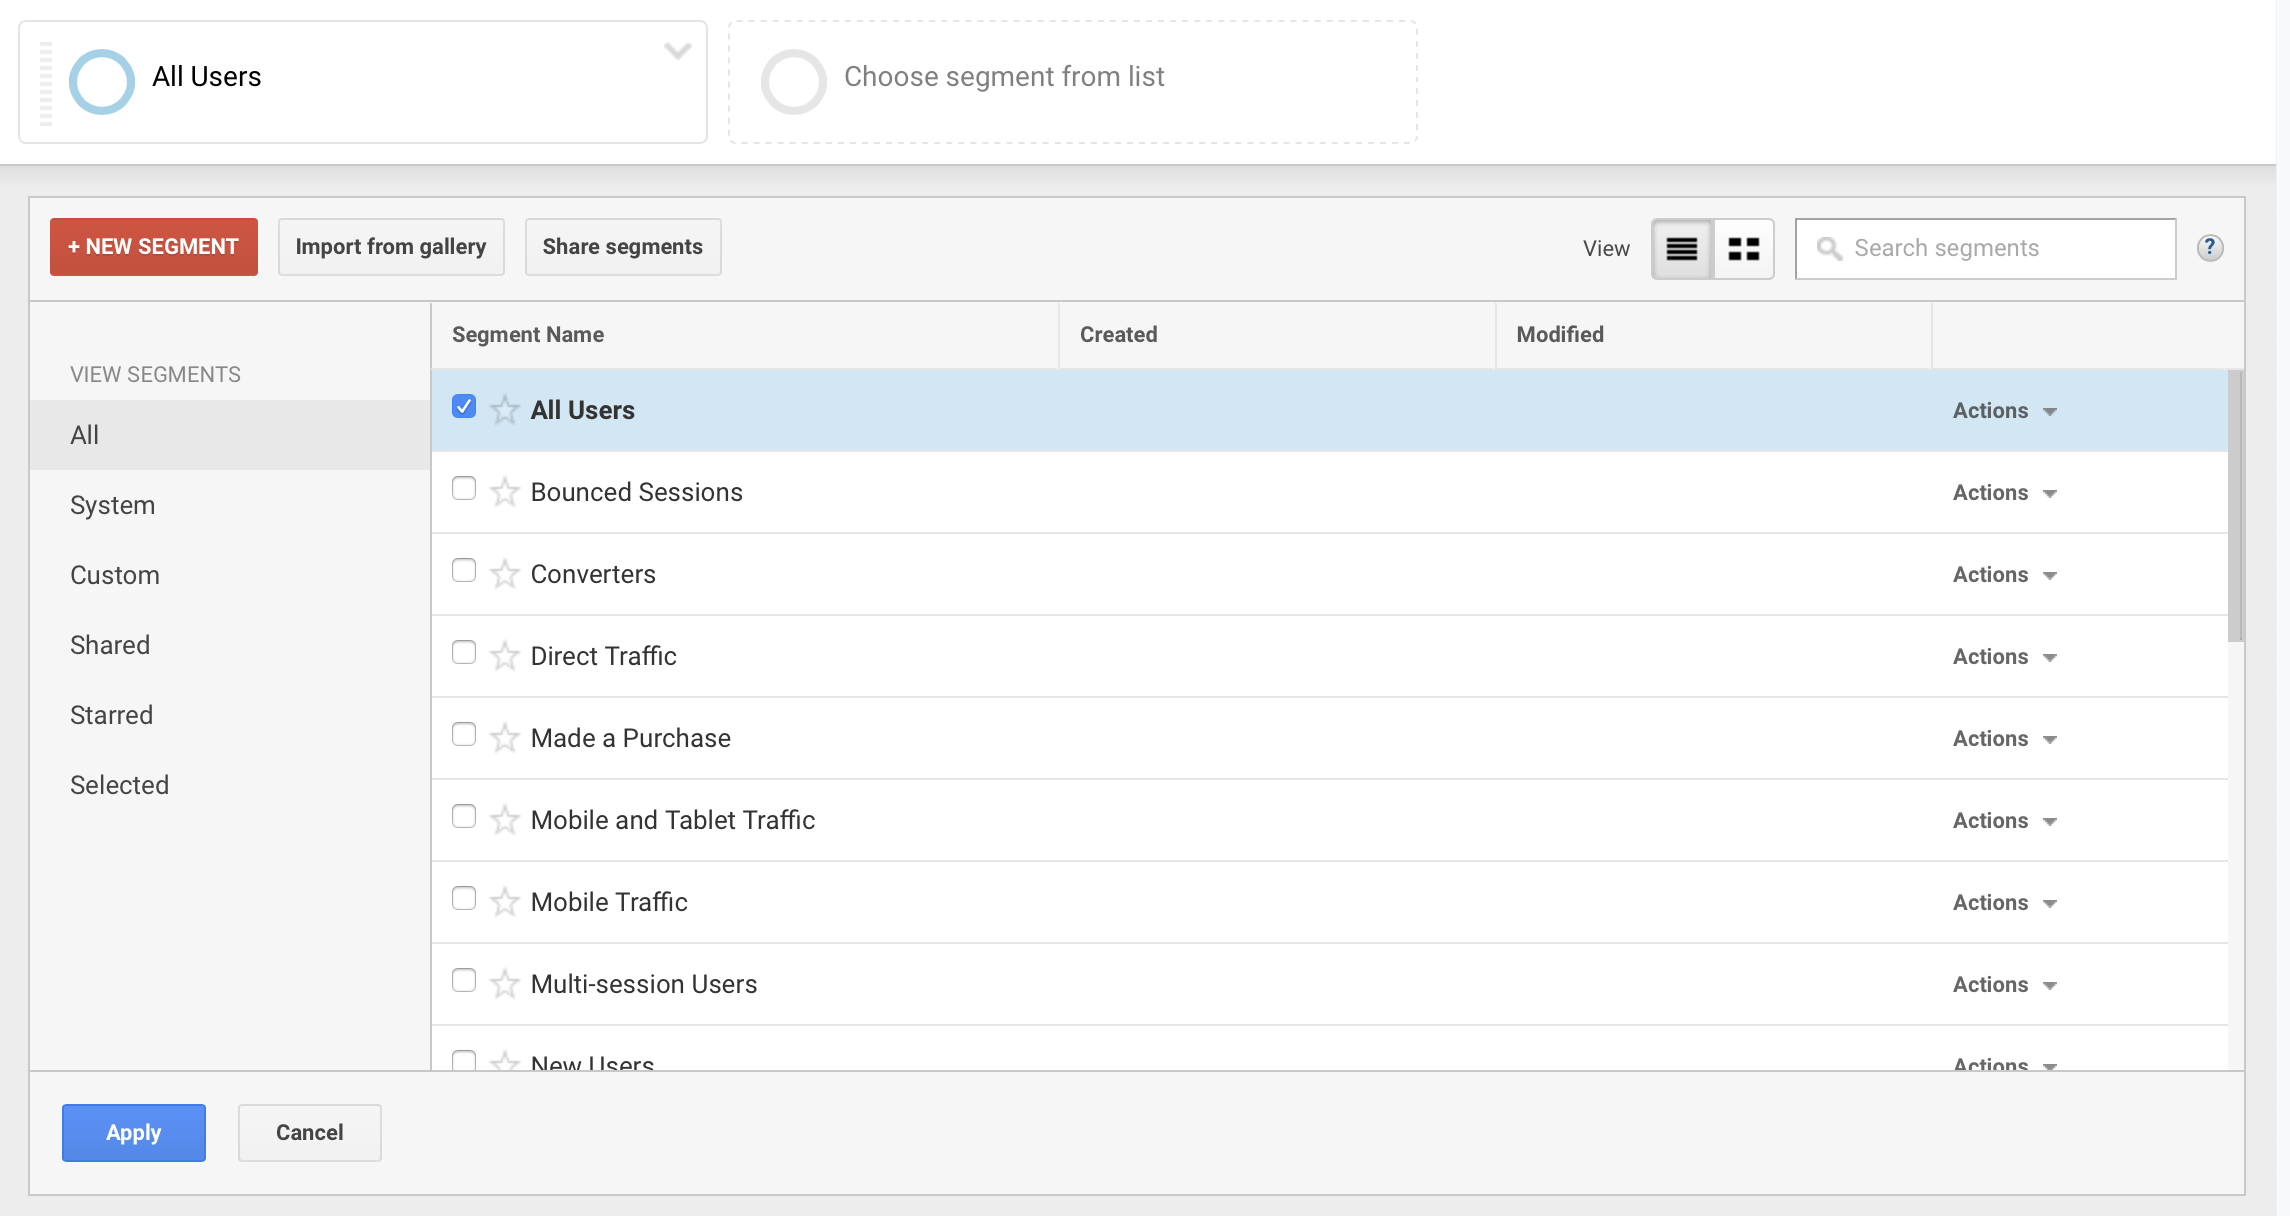
By default, the Audience report will take 100% of the sessions of our website as a reference for the data, but we can apply or create segments to filter the results. Simply select 'Add Segment' and select an action you want that segment to be created based on (e.g. made a purchase, direct traffic, mobile traffic, etc.). You can then compare the overall audience data to your segment audience data.
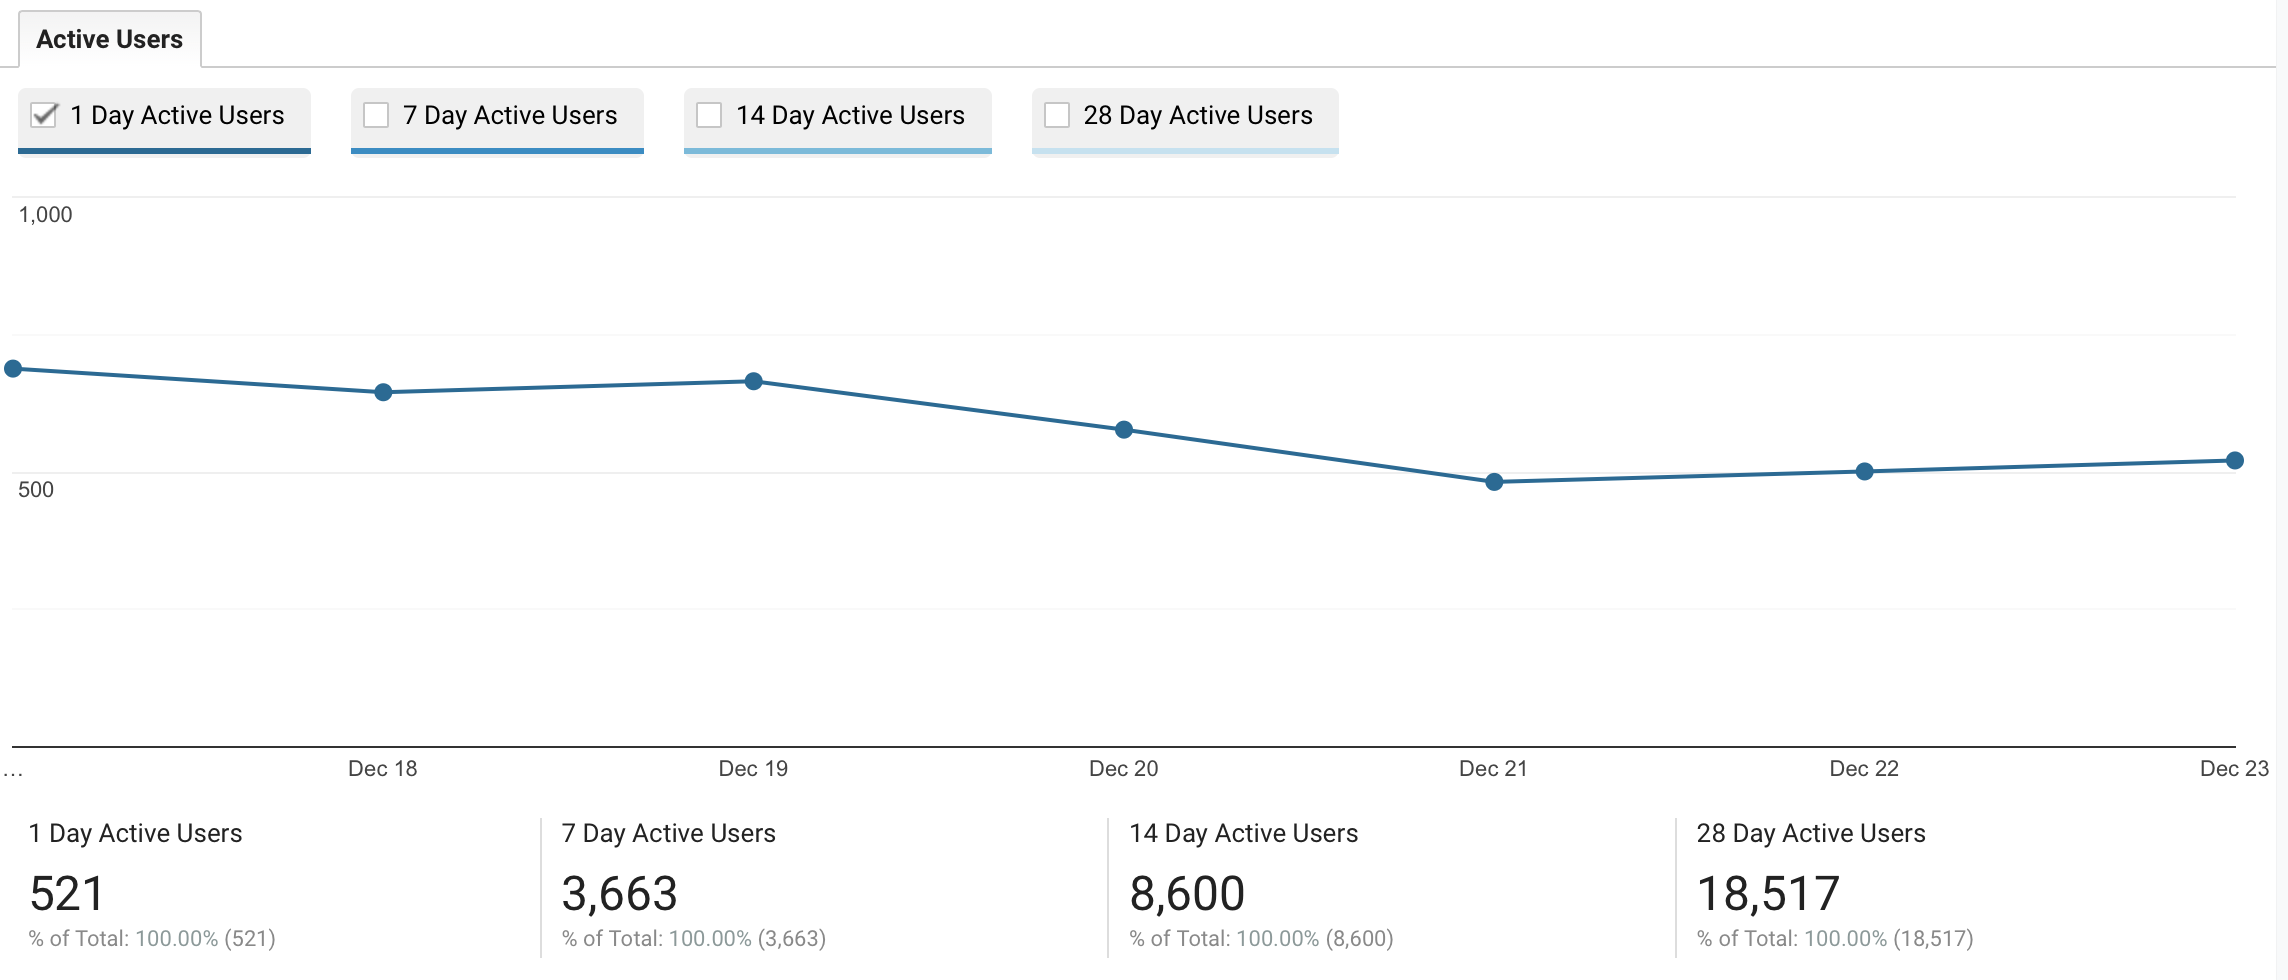
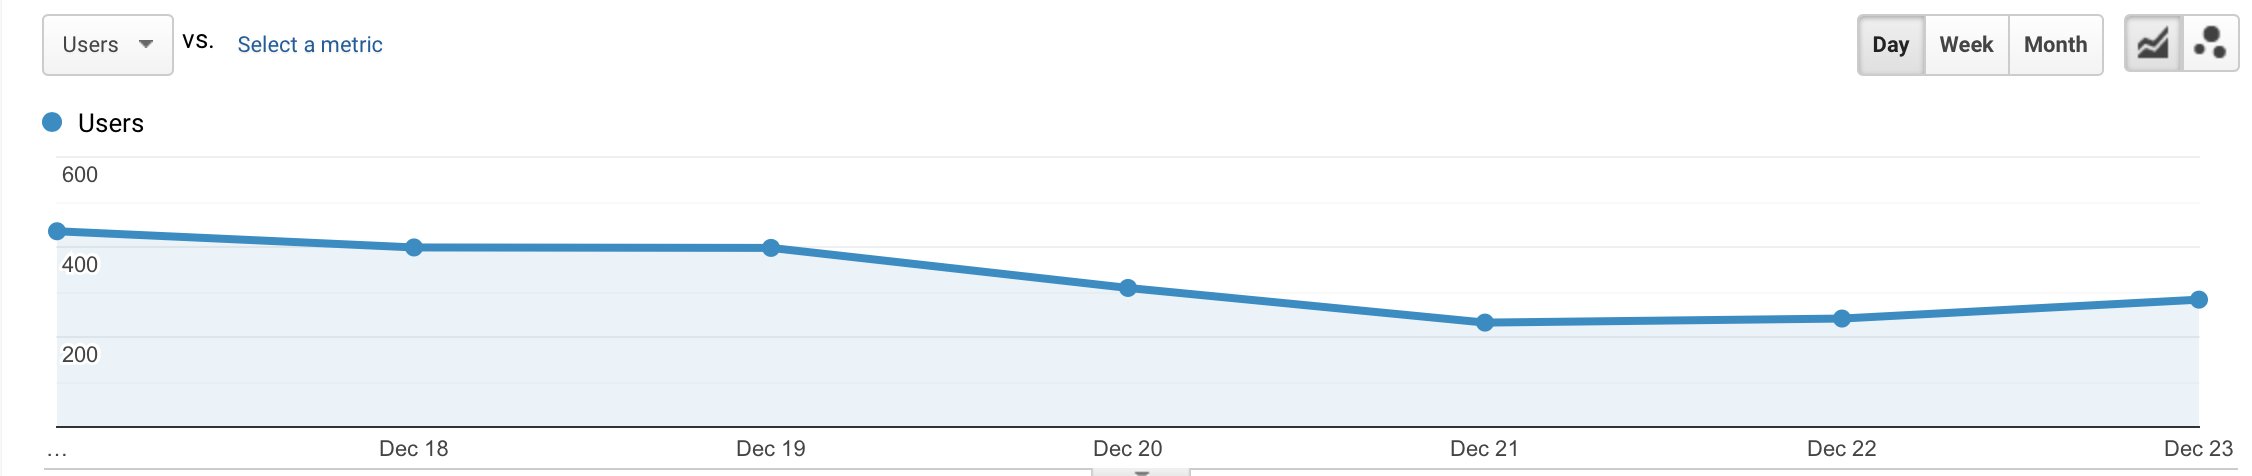
Active Users
This section shows the number of active users within the period of time that we have selected. We can also choose to show the graph by the number of active users across one day, 7 days, 14 days or a month. As seen before, we can also take 100% of the active users to show the data or add a segment to use to display the data.
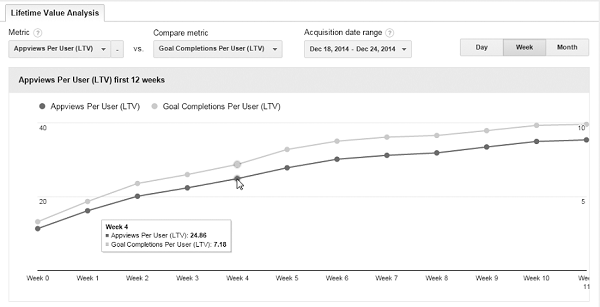
Lifetime Value
In this section, you can determine the value you give to each website user to analyse the performance you are getting from your traffic. To do this, you must select a metric that helps you determine the value you give your users (this could be the number of page views per user, sessions per user, revenue per user, etc.).
Cohort Analysis
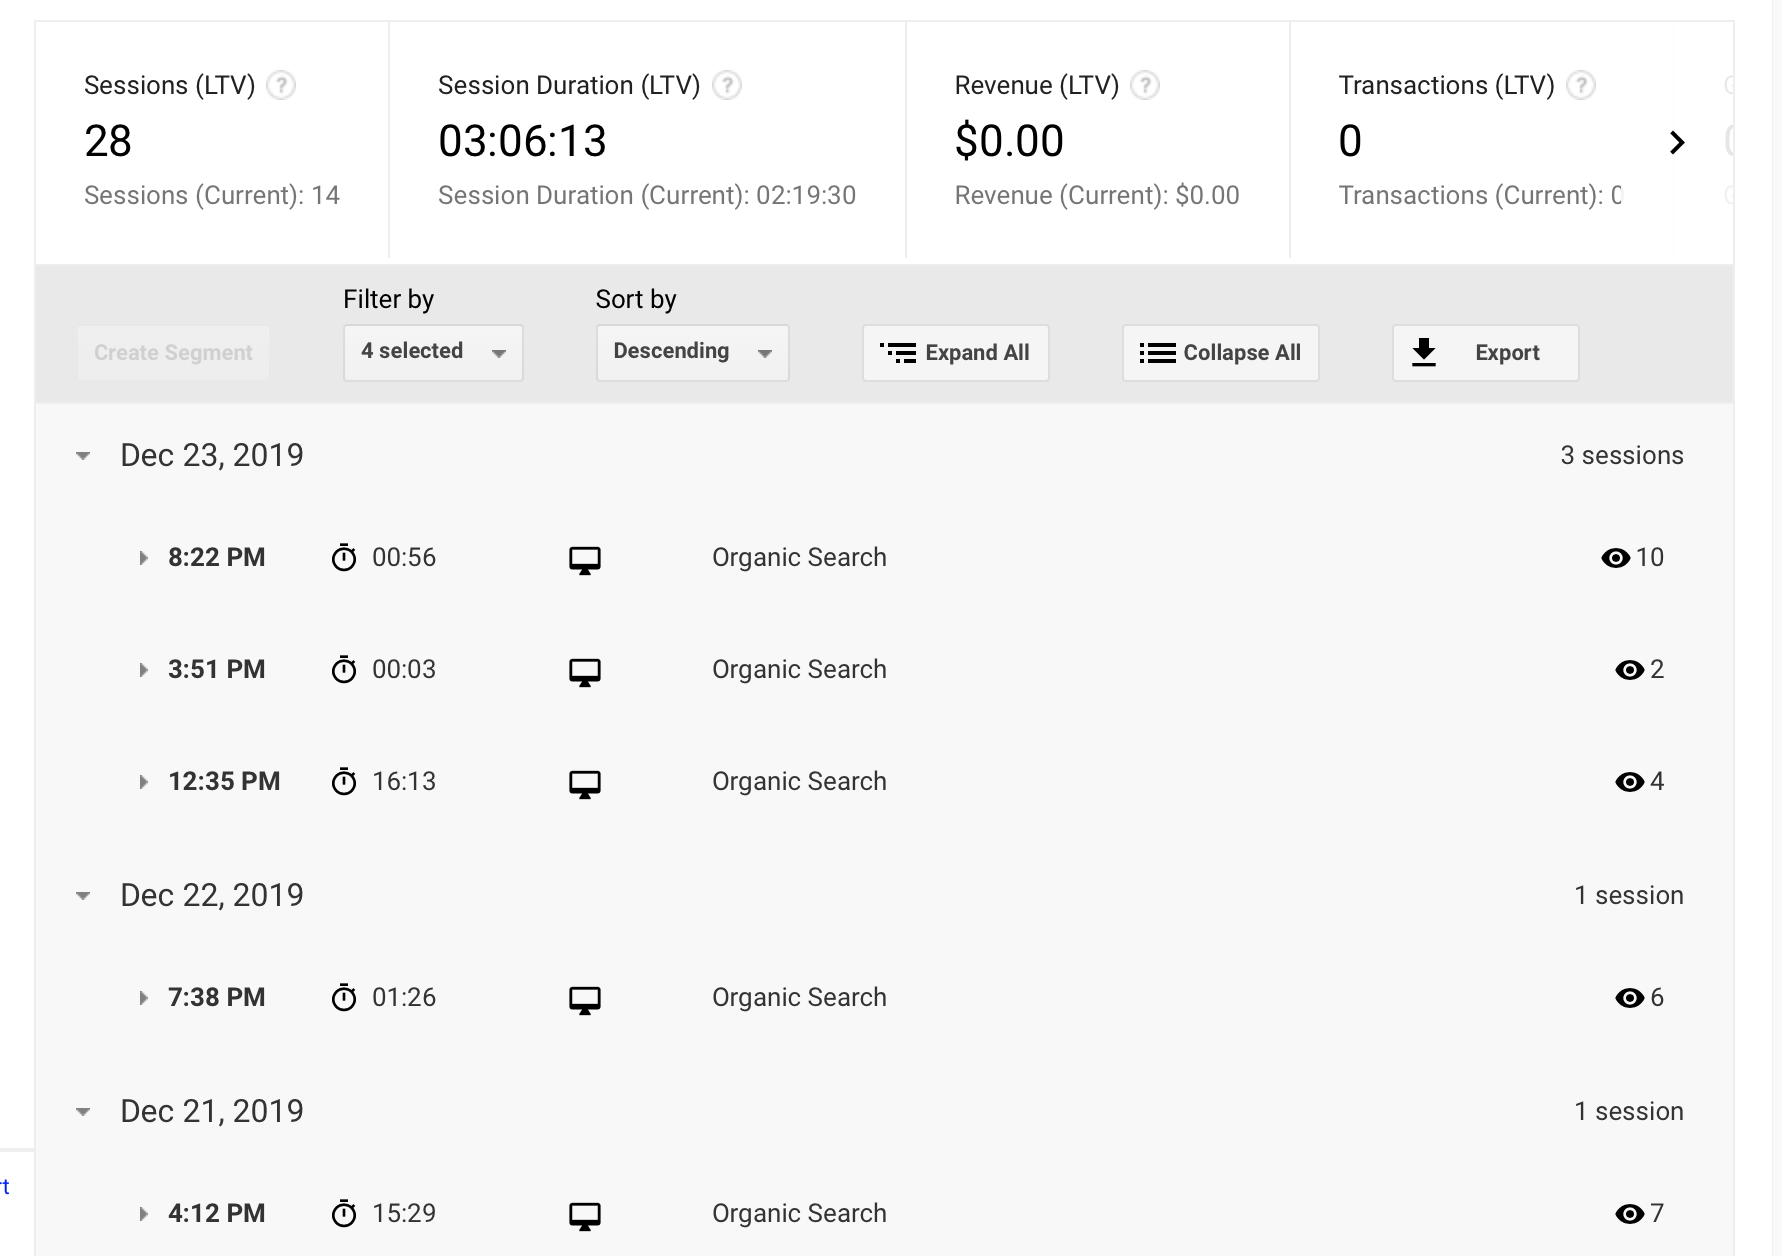
Google Analytics assigns an ID number to each user. So this section allows us to explore how users behave on our website individually, indicating the number of sessions performed by that user, the average time spent on our website in each session, the bounce rate, etc.
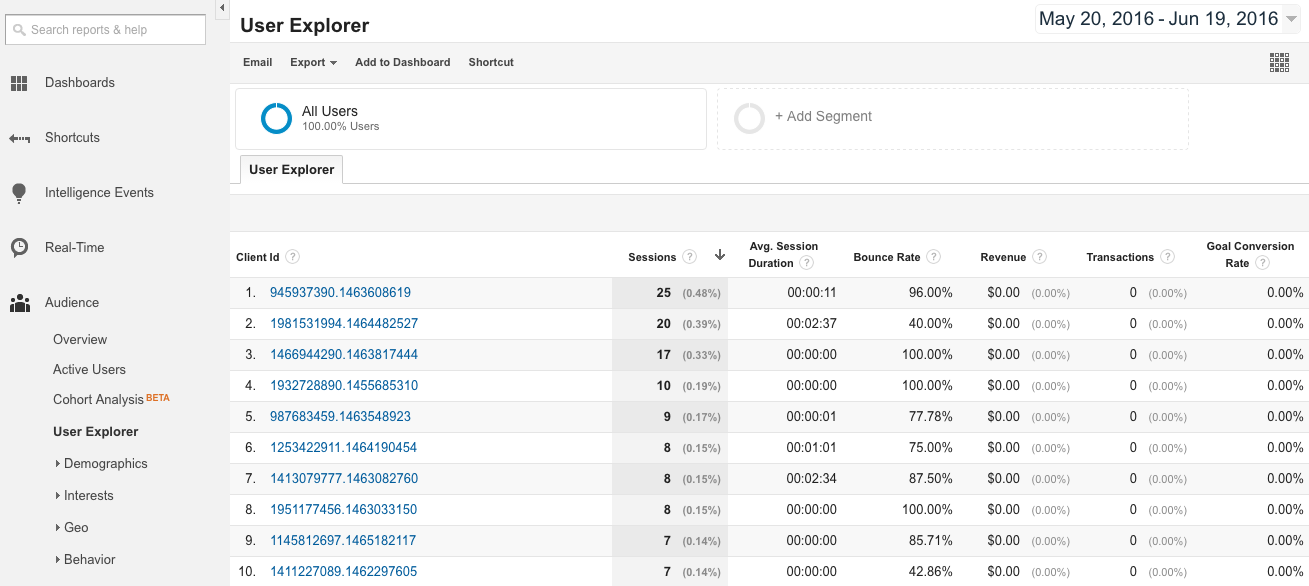
By clicking on any of the user IDs, we can access a specific report of that user and find out the sessions he/she has done in one day, at what hours, for what duration, the pages viewed in each session, through which traffic channel he has accessed the website, if they accessed the site from a mobile device or a computer, etc.
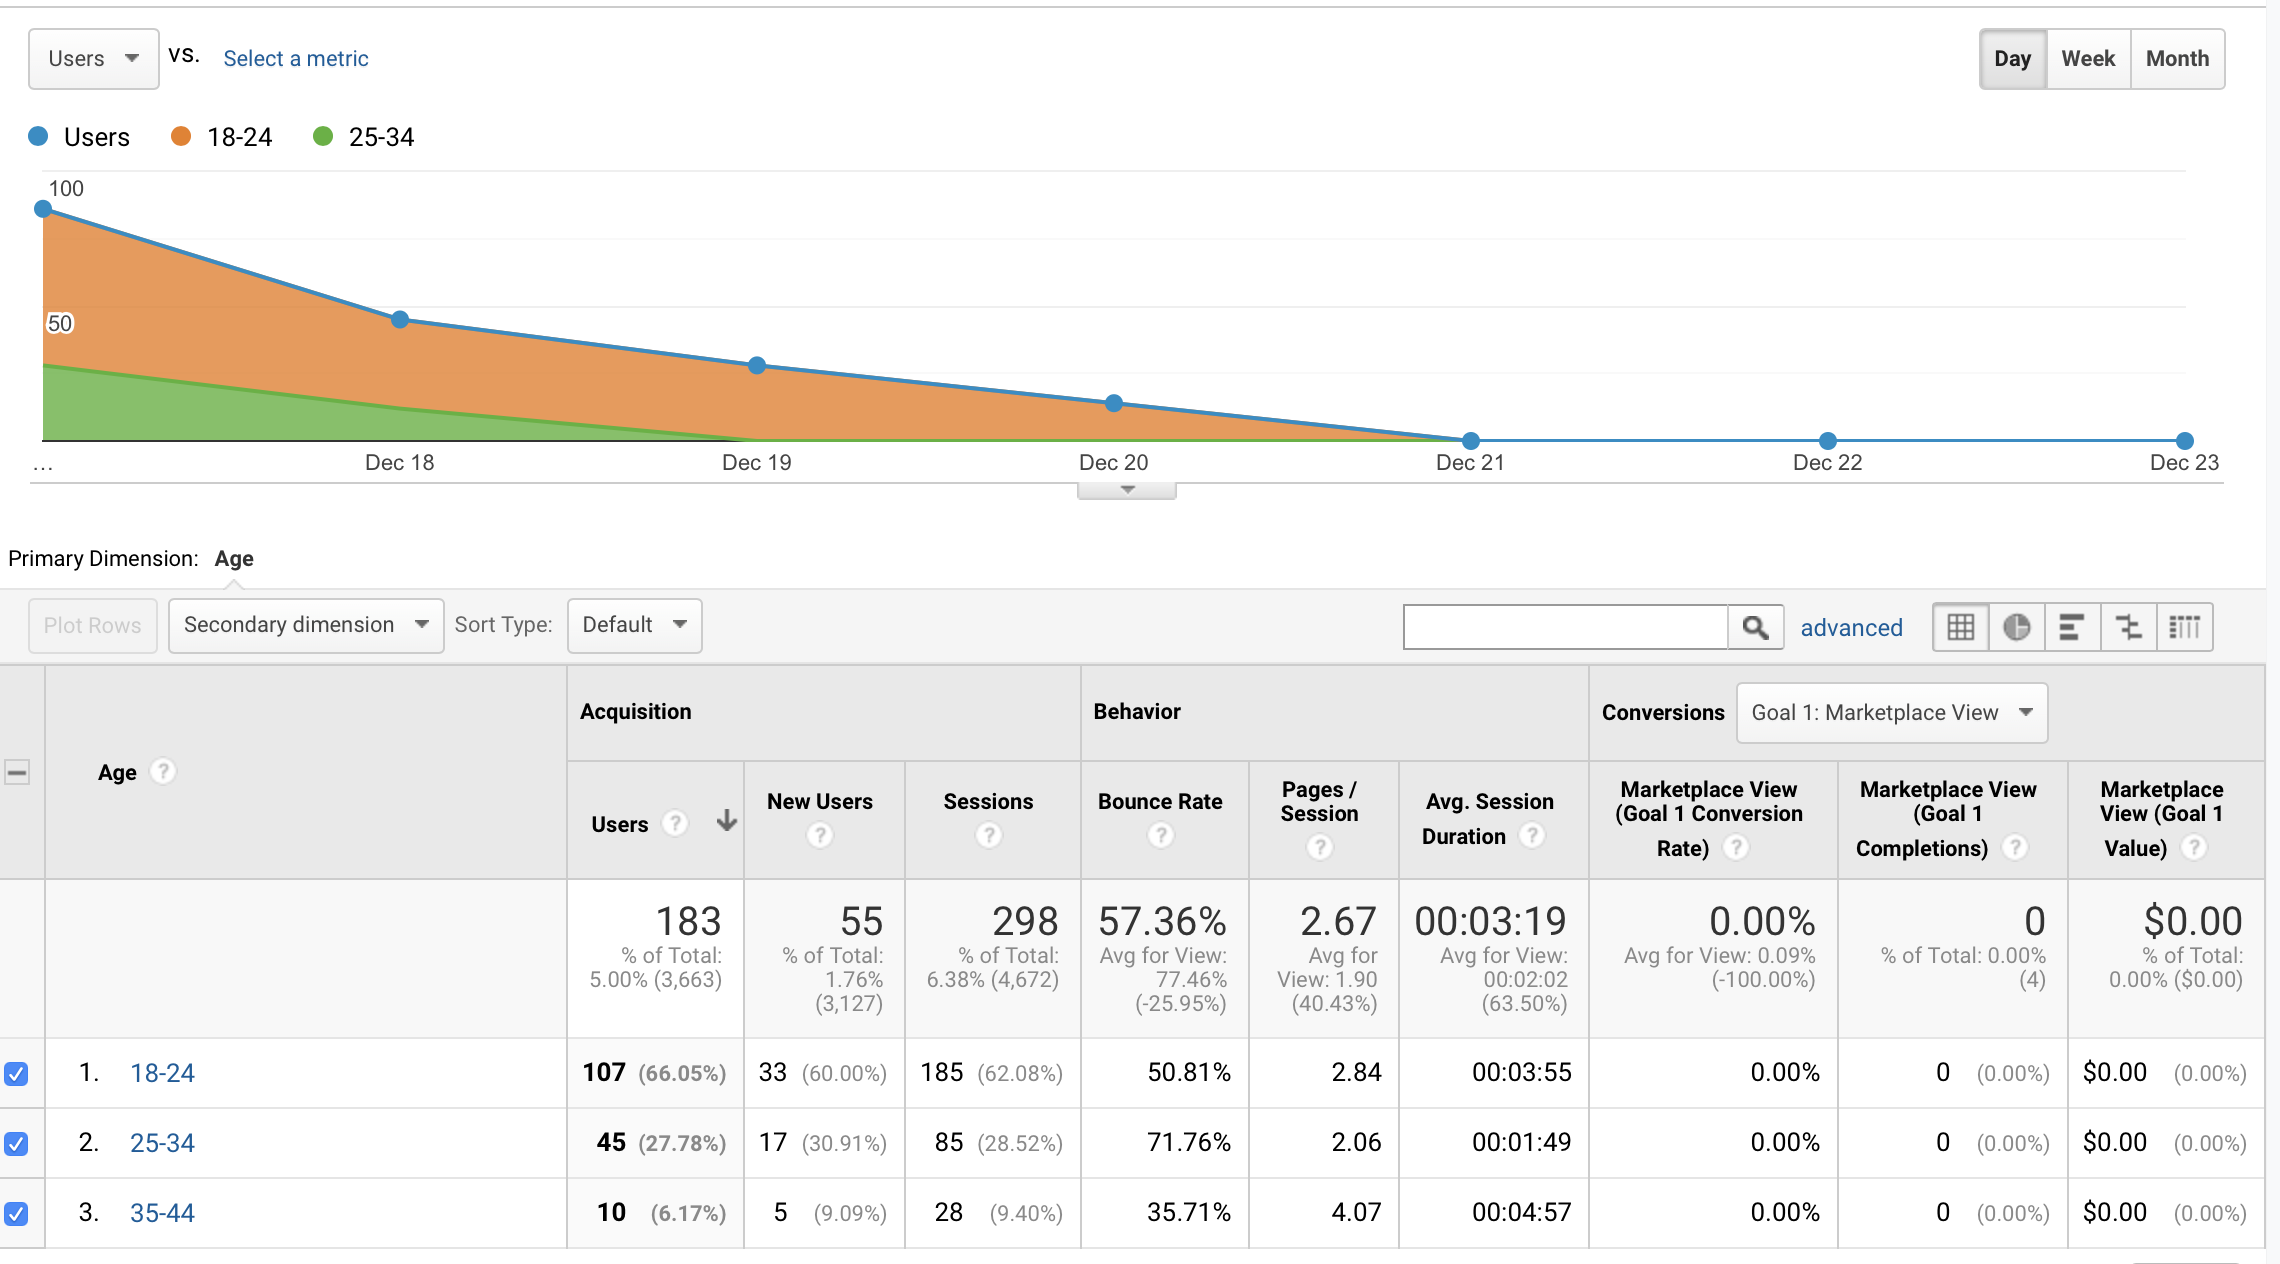
Demographic Data
In this section we can find out the breakdown of our users by age, sex, etc.
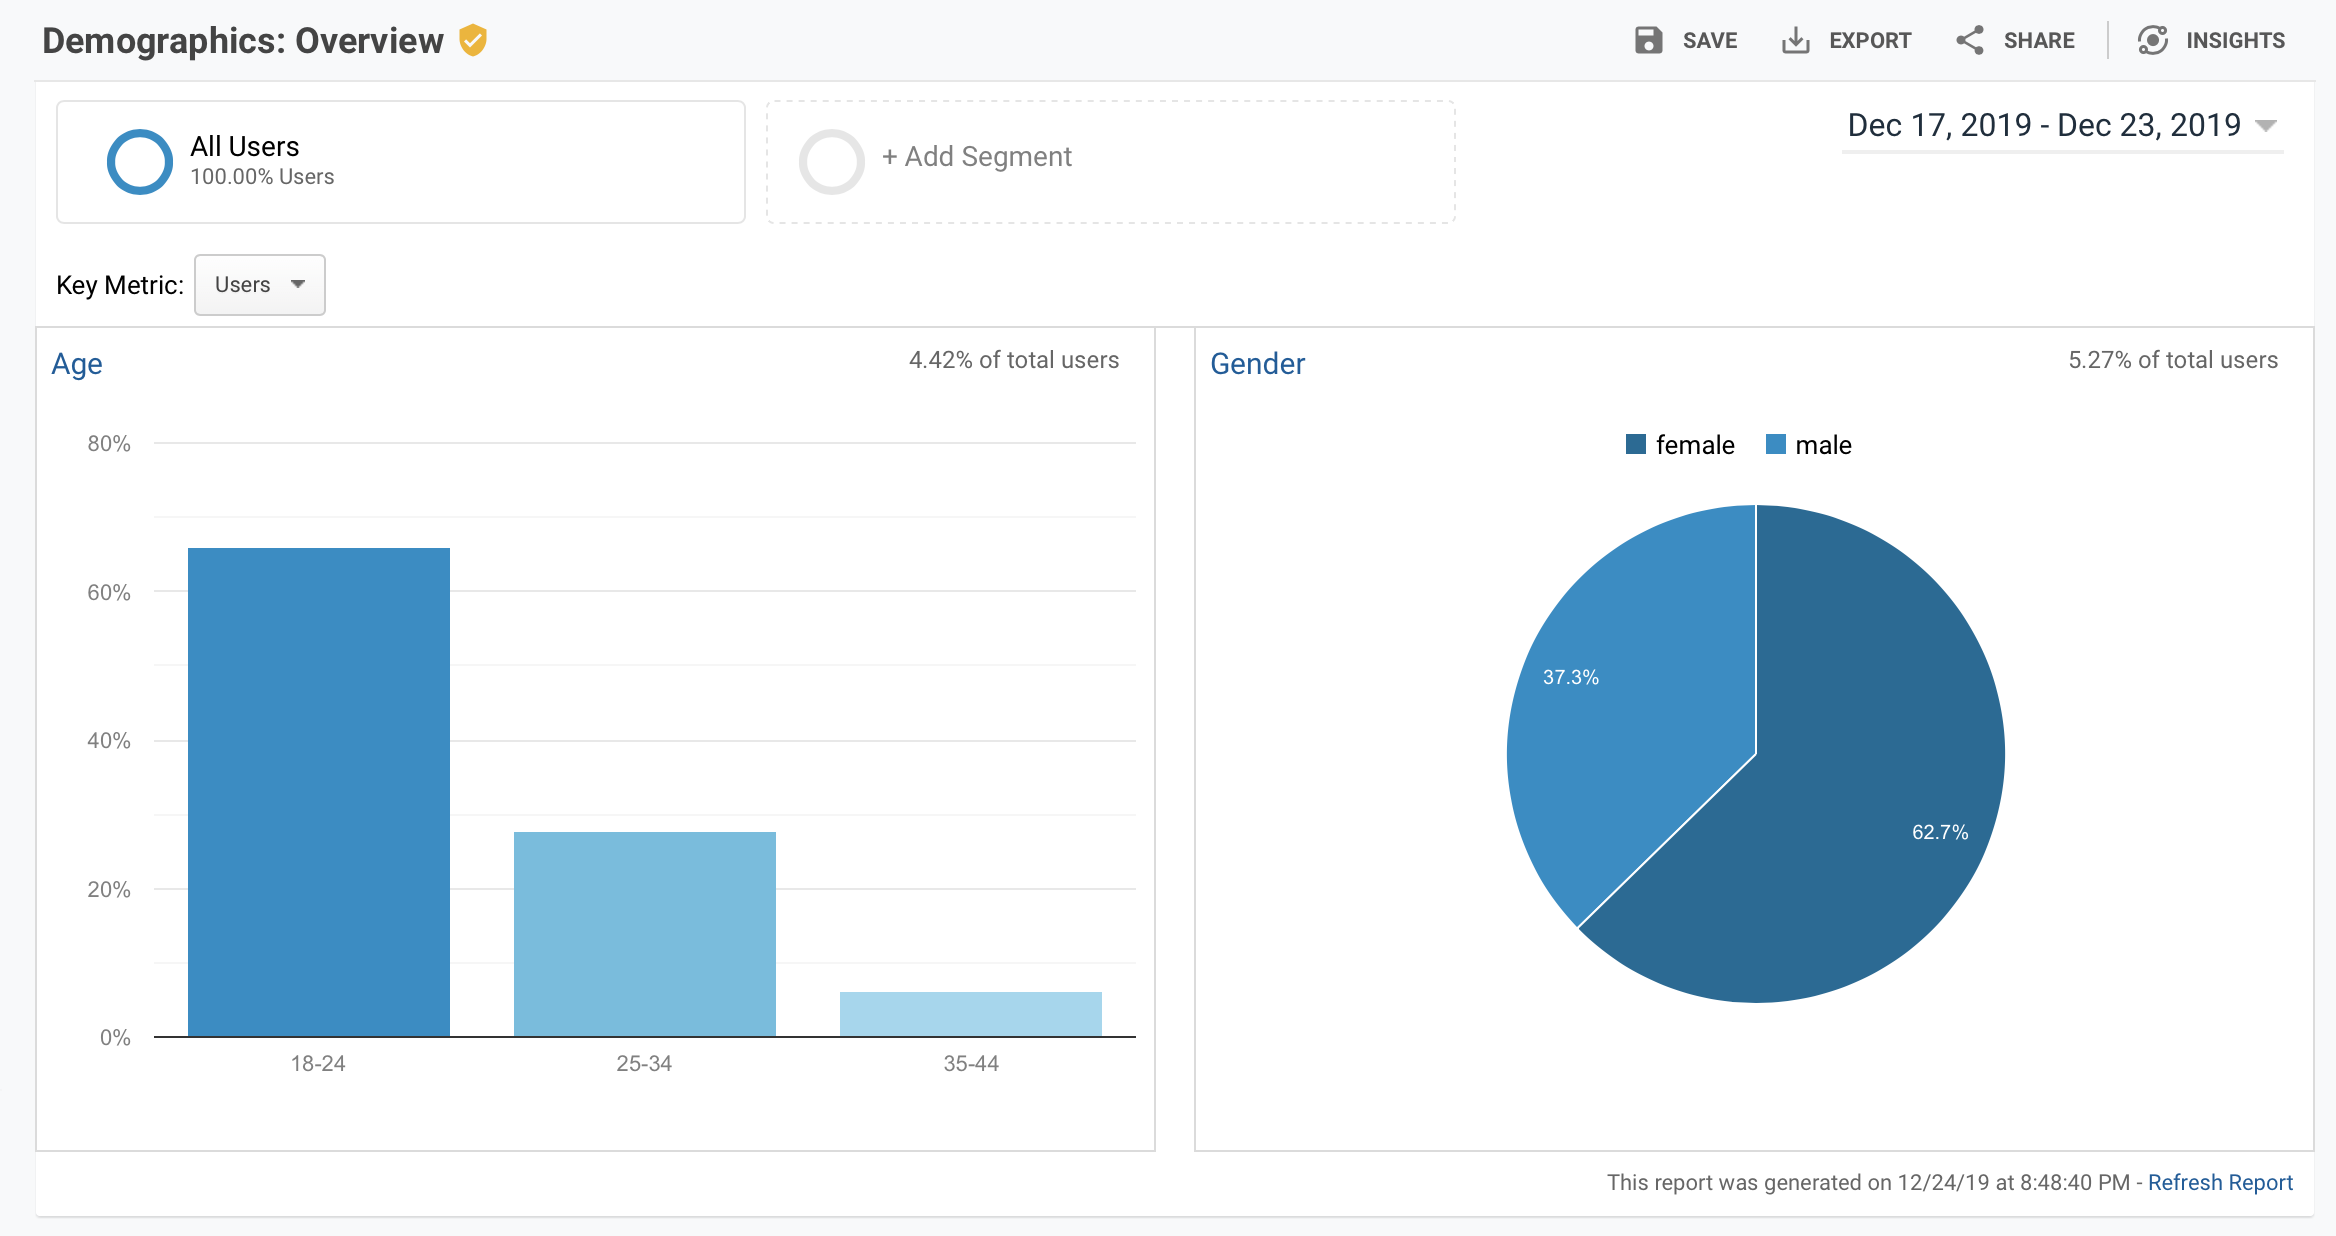
Google Analytics shows us the information of our users by the age group they are in: number of sessions, average duration of visits, percentage of session bounces, conversions, etc.
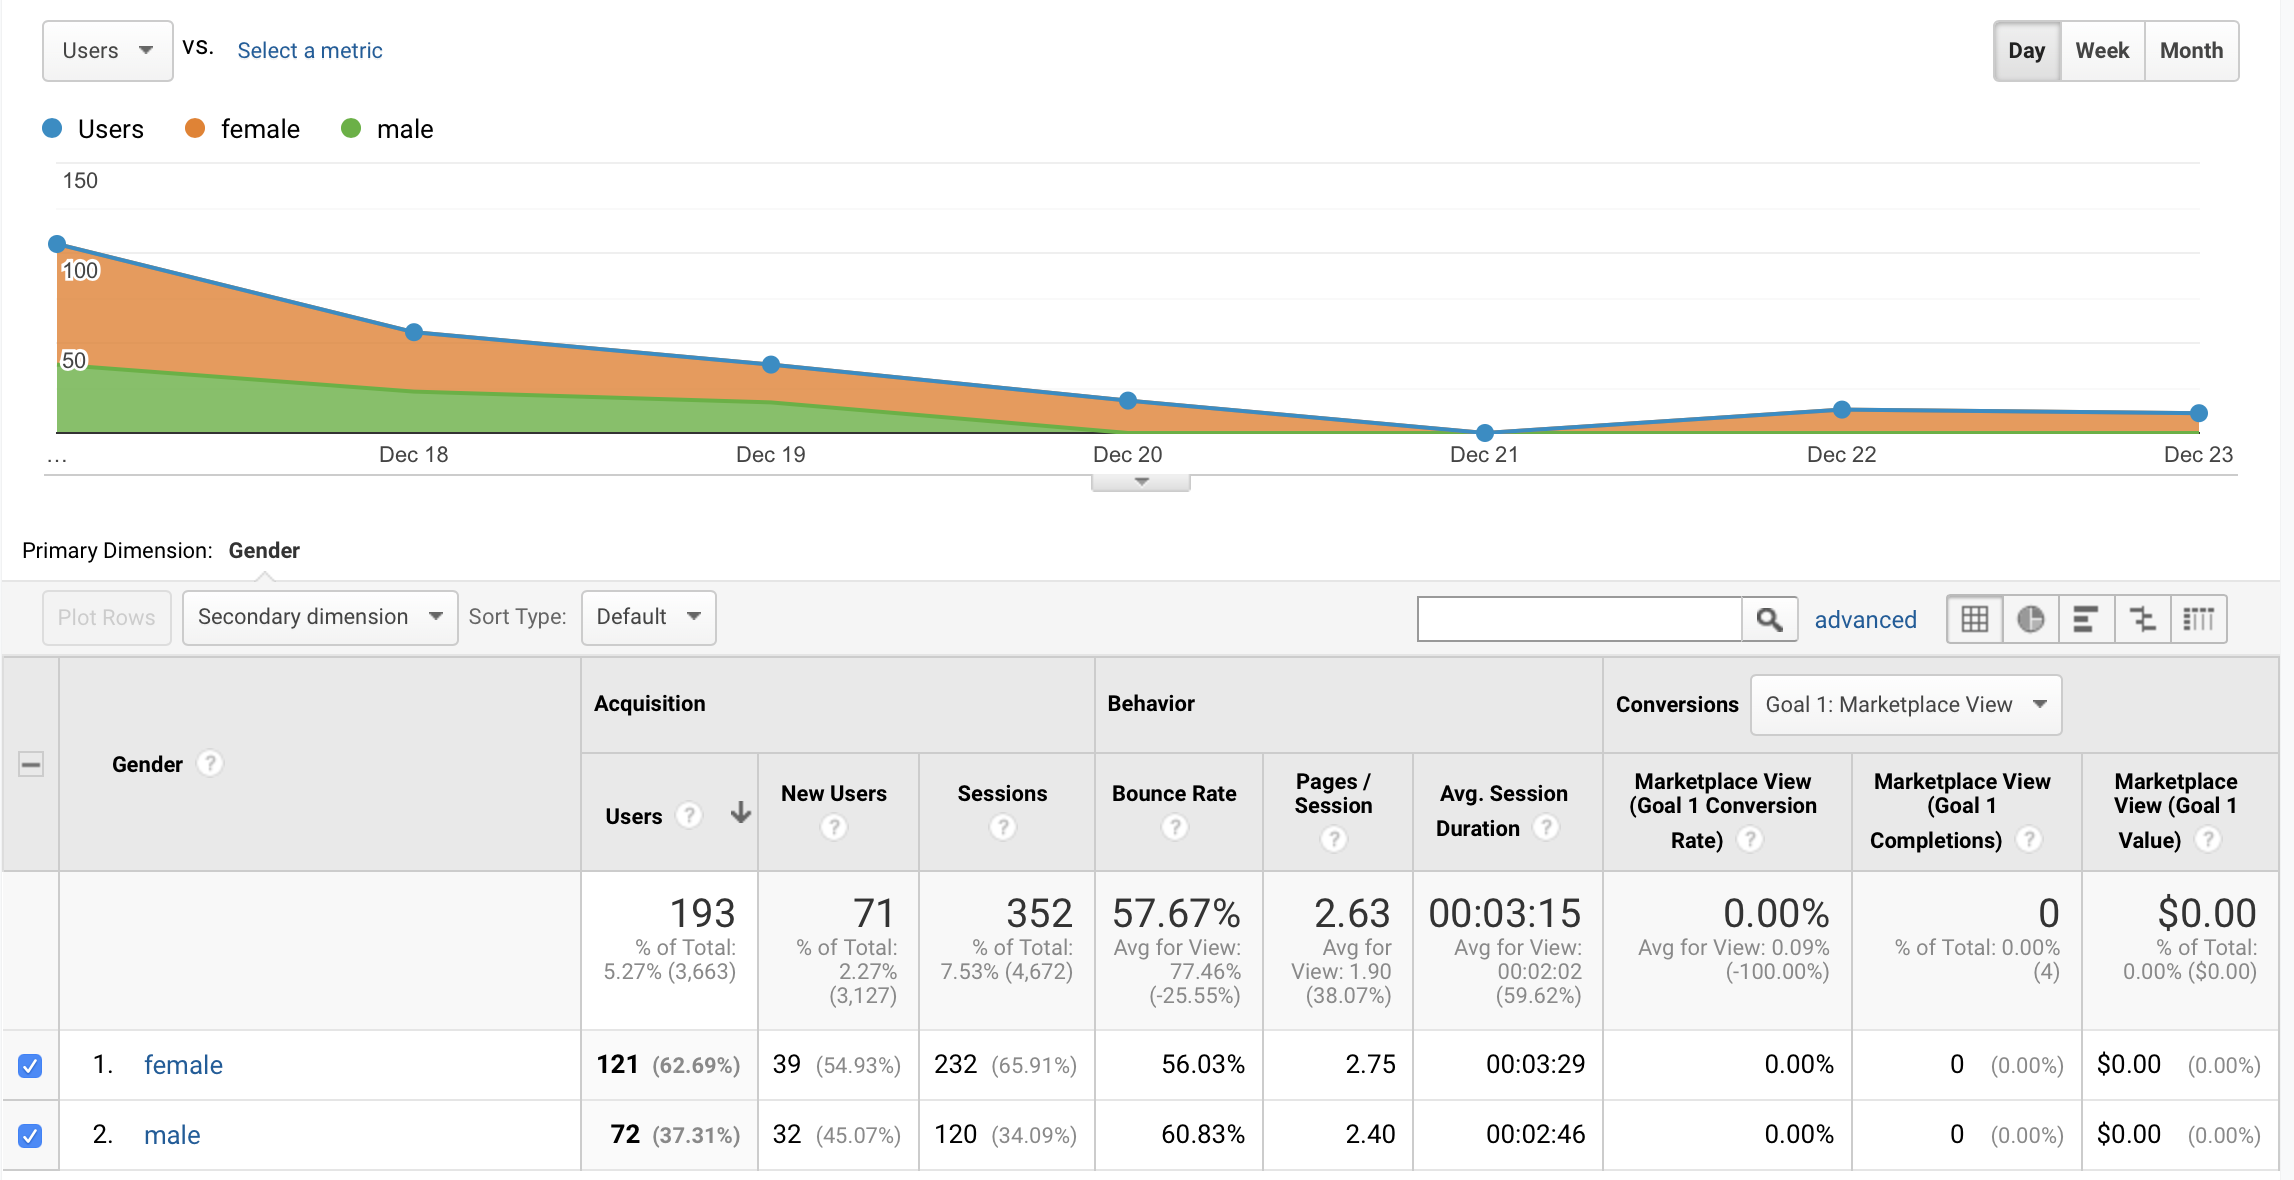
Likewise, Google Analytics provides us the same data for the gender of the user:
Interests
Google knows what interests us based on the pages we visit. This information is known by the use of cookies that leave a trace of everything we do while we navigate online.
Based on all this information, it allows us to obtain data of the interests of the users who visit our website based on different parameters that Google Analytics calls: affinity categories, market segments and other categories.
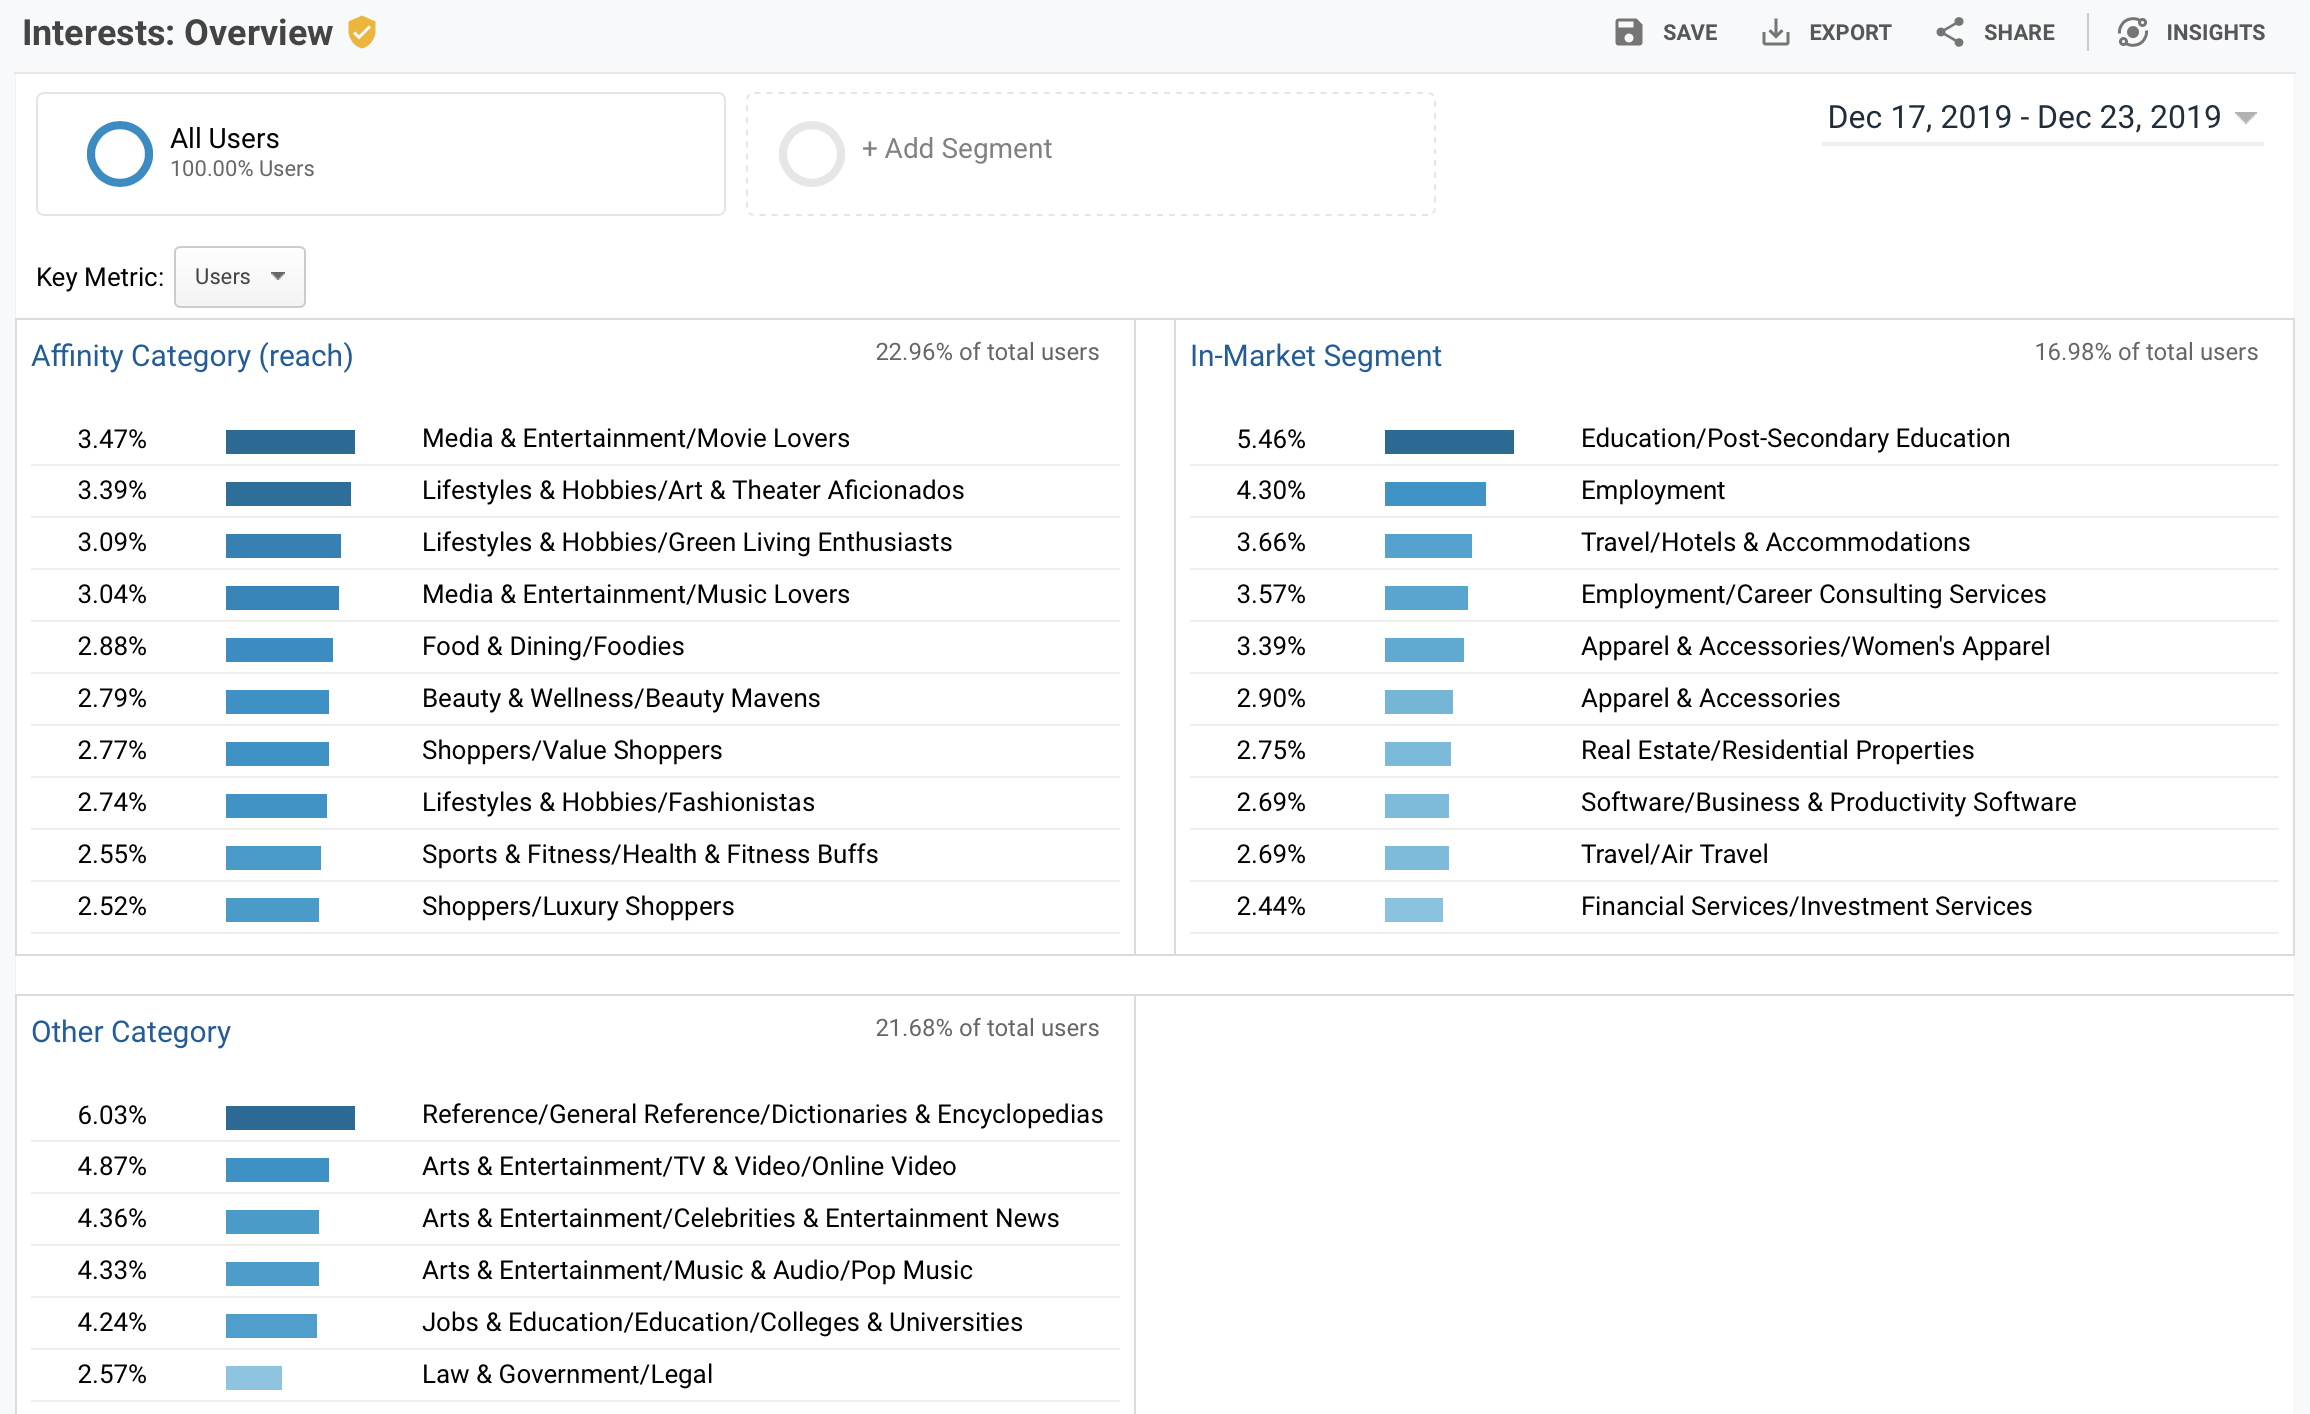
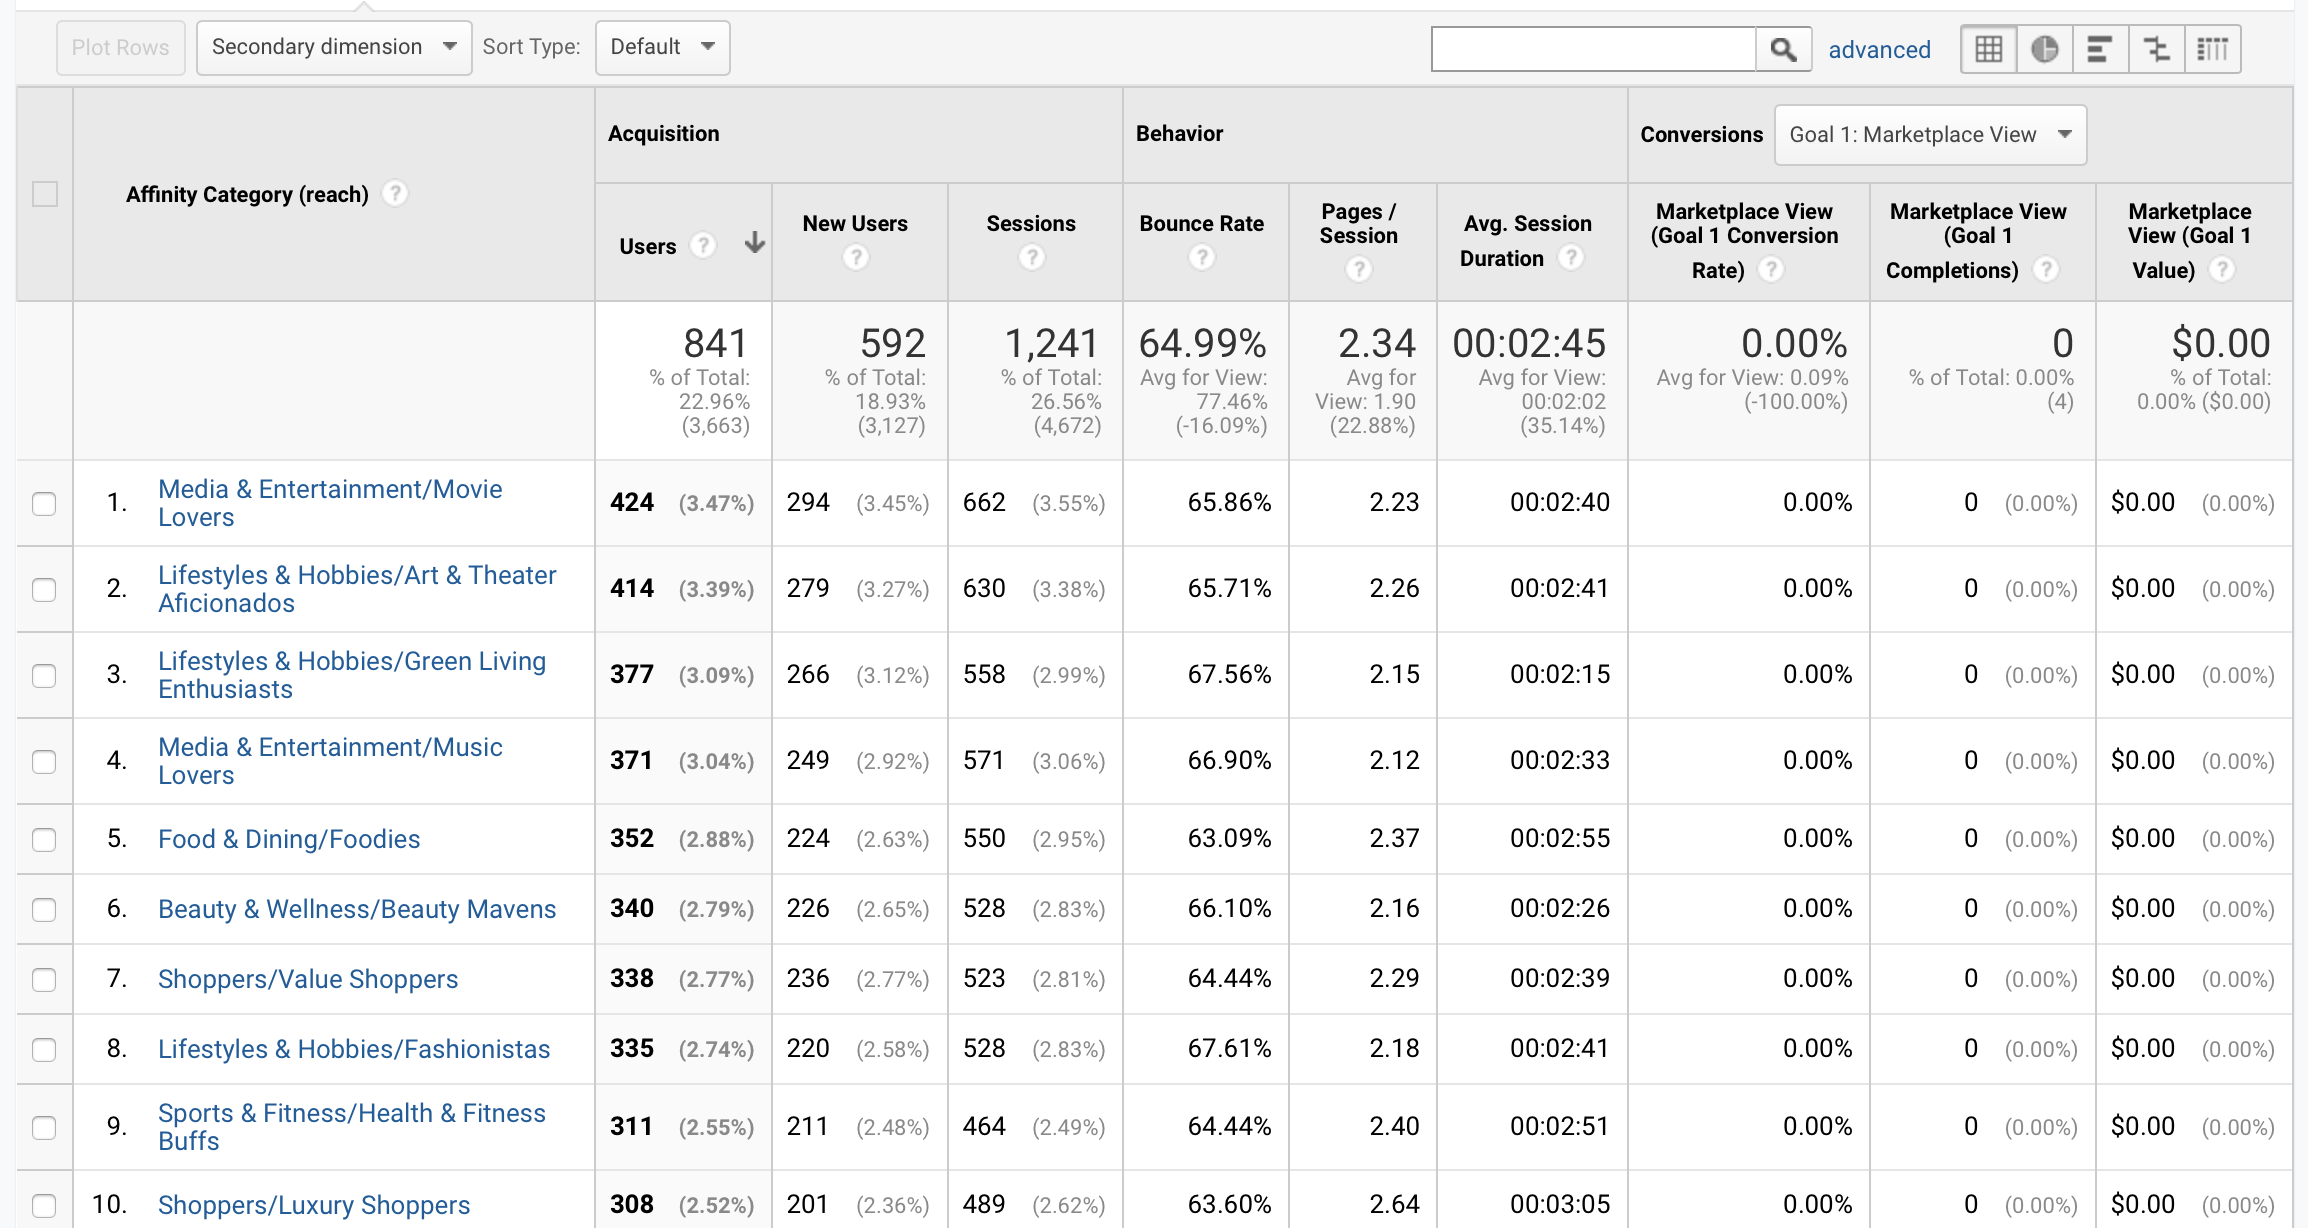
Affinity Categories
Affinity categories represent the tastes and interests of our users based on the themes of the pages they visit most. So, in short, this data allows us to see the vast range of interests your users have.
In this section, Google Analytics provides us with a list of these affinity categories, with the data of the number of sessions performed by the users of each category, the bounce rate, the duration of visits, conversions, etc.
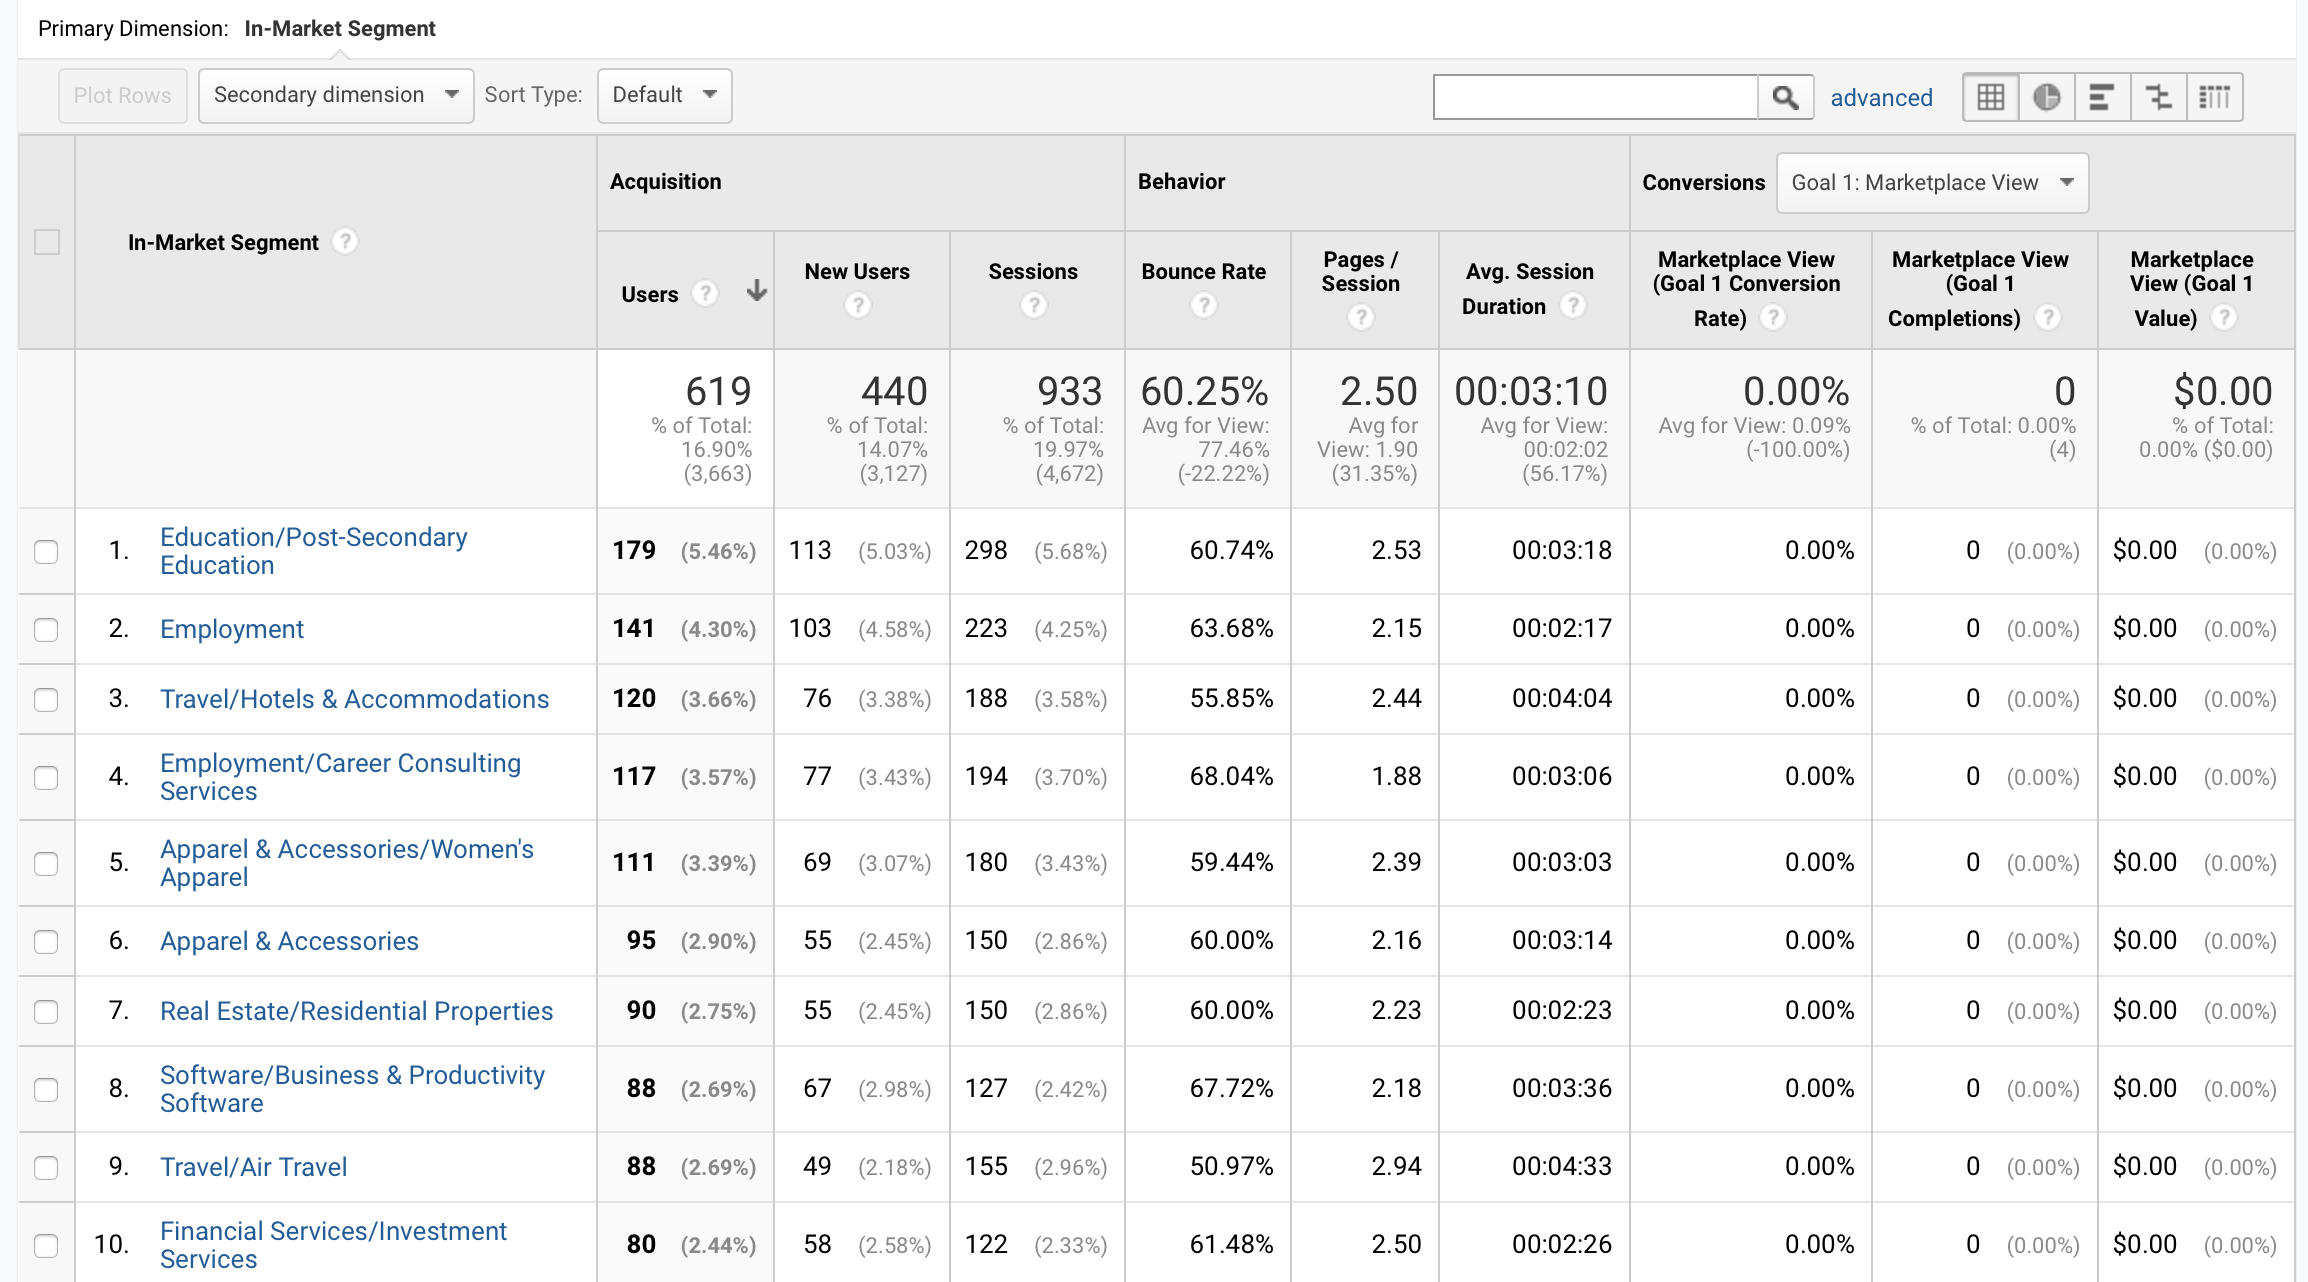
In-Market Segments
In-Market segments are the categories in which users of our website have shown a greater predisposition to perform an action or conversion, either because they have purchased, made a registration request, etc on that category of website.
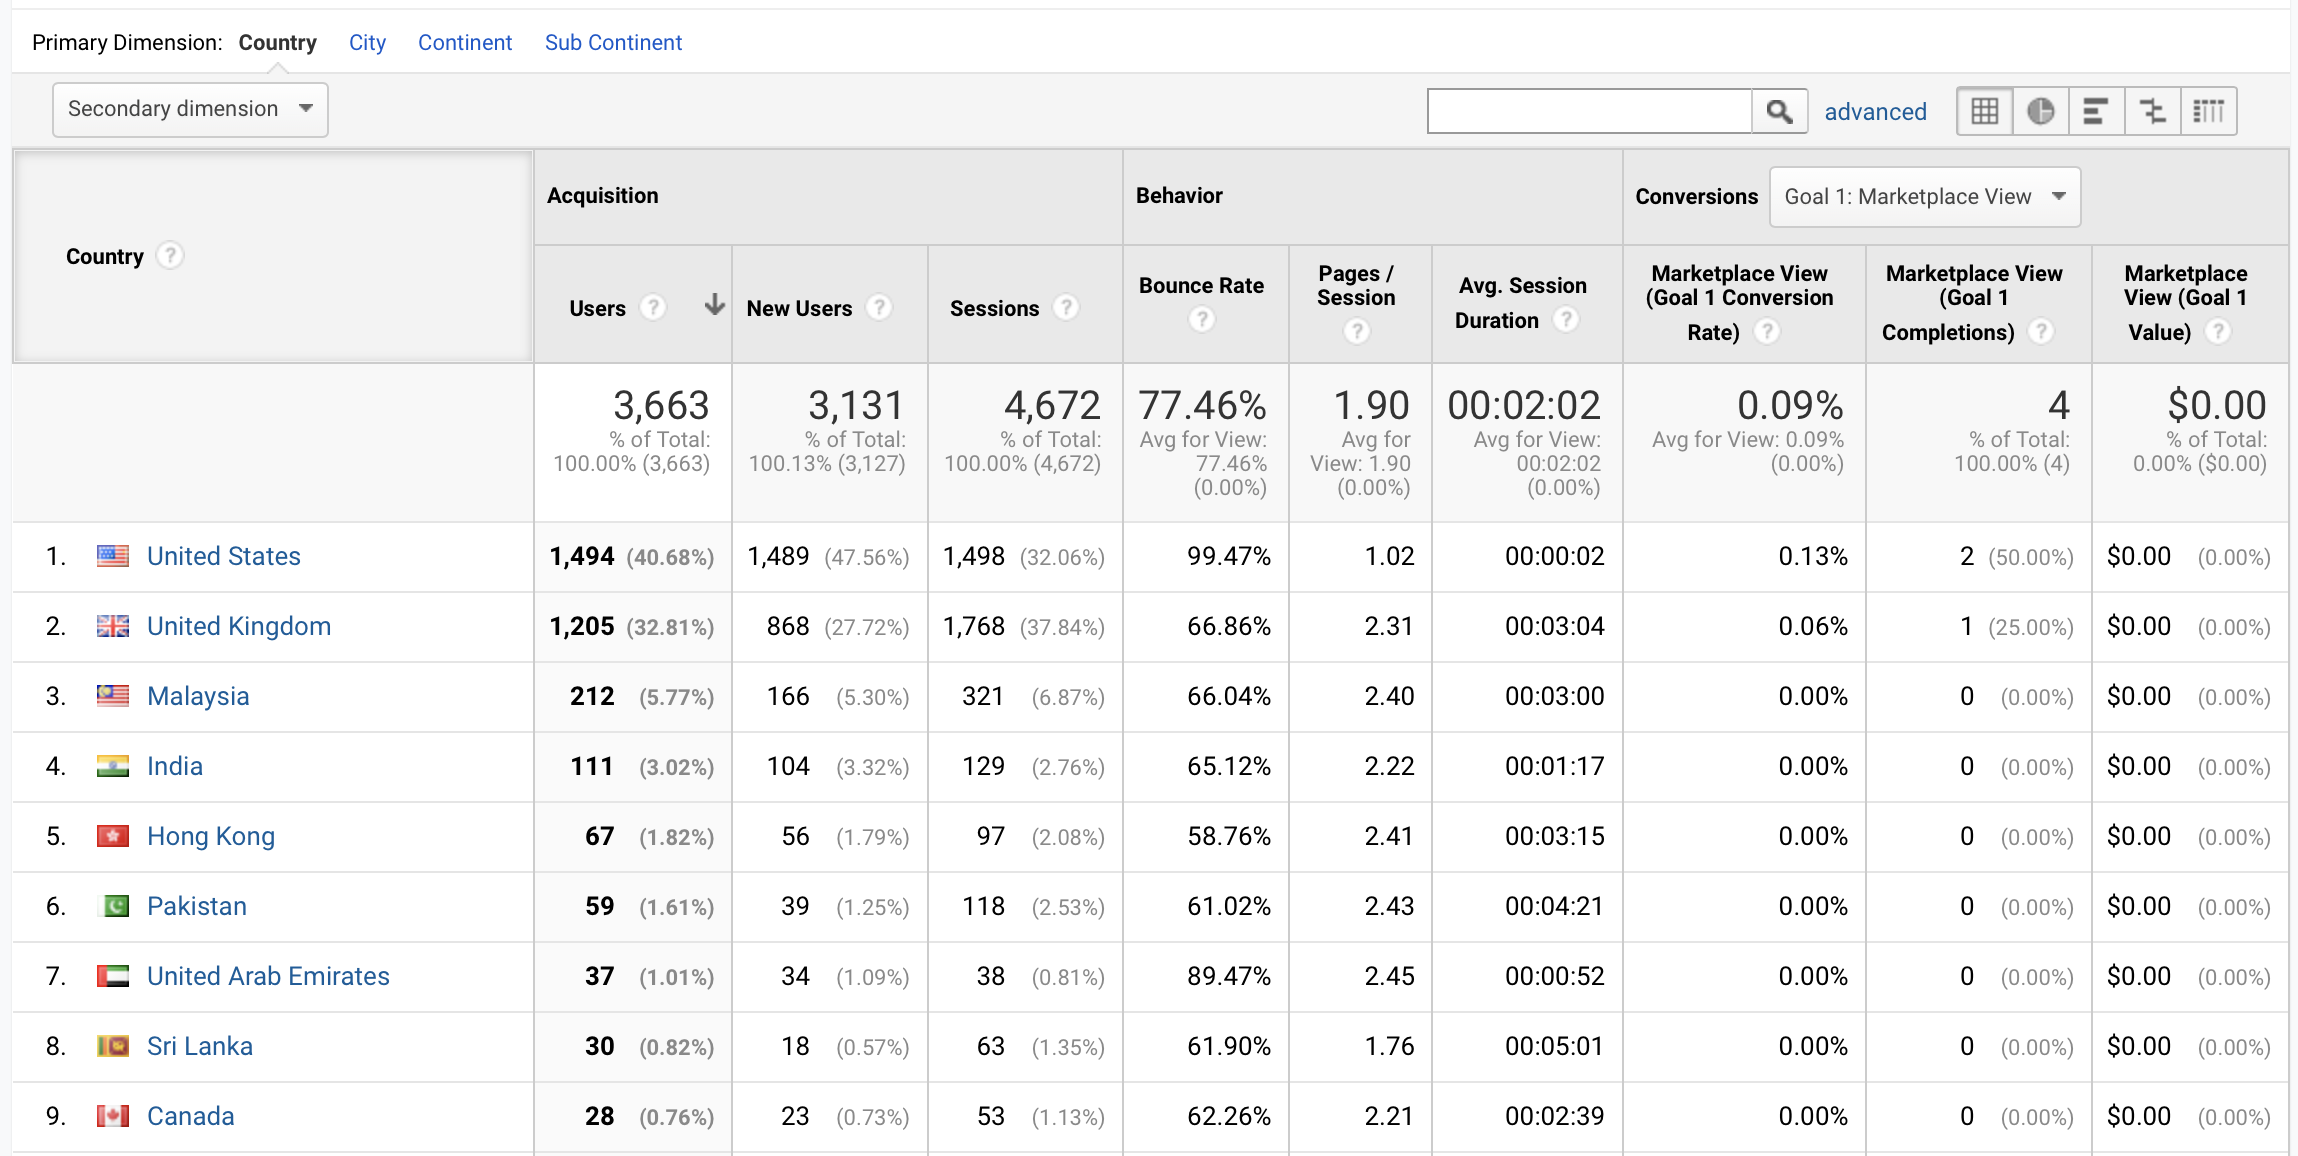
Geographic Information
In this section you can find out which countries, regions, cities your traffic comes from and the language in which users have their browser configured.
Regarding the location, you can find out the number of sessions by country in a given period and the quality of visits by countries. By clicking on each country, you can access detailed information by cities or regions.
Behaviour
This section is a small preview of the complete behaviour report that we will see later.
For now, here we can access the information on the number of users who visit our website for the first time (new users), and comparing data between new users and recurring users.
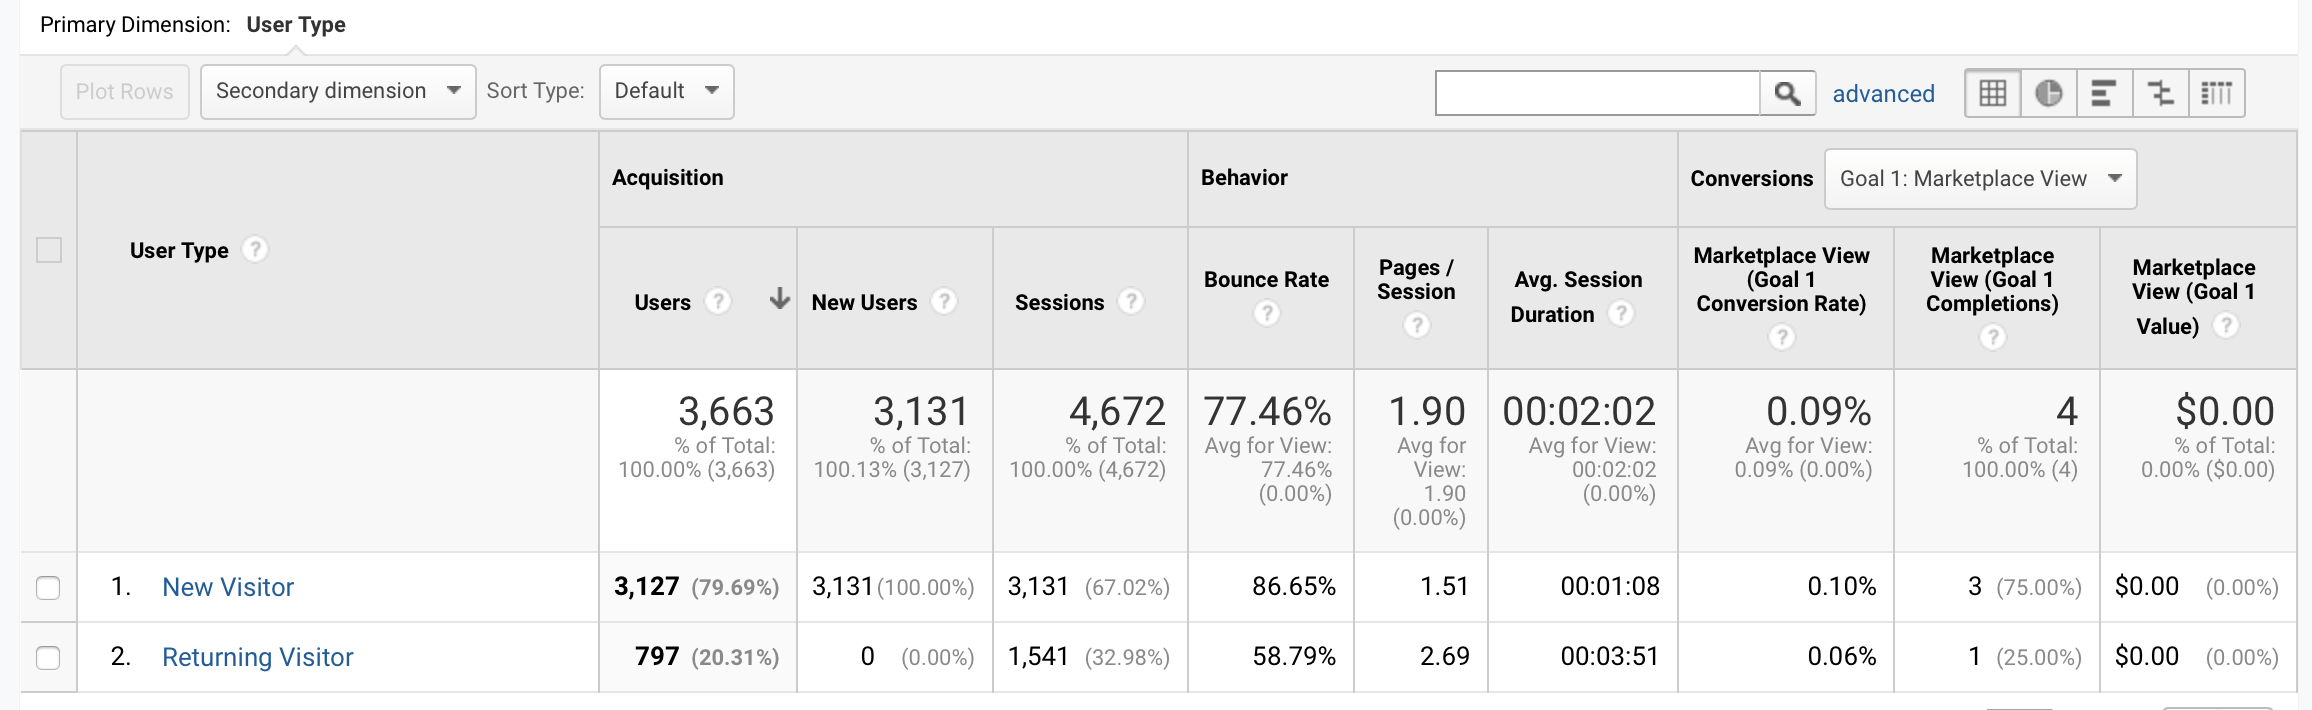
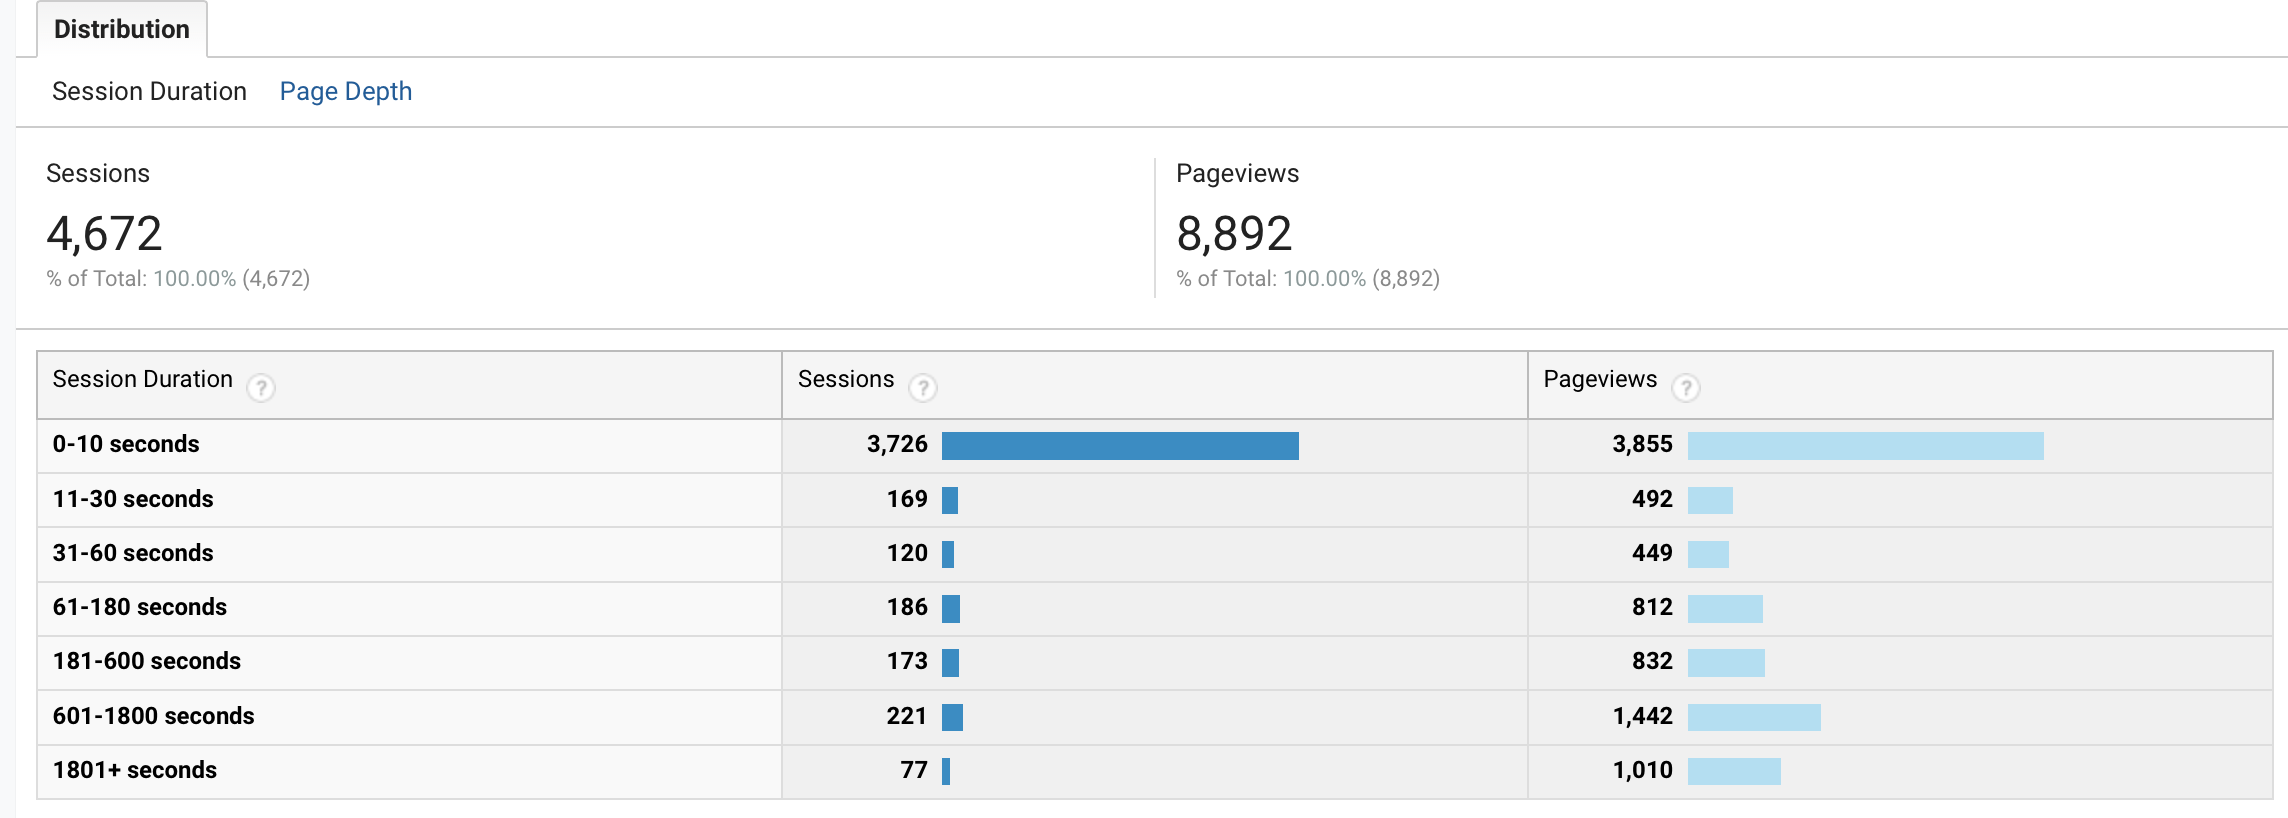
We can also see information about the duration distribution users are on the website.
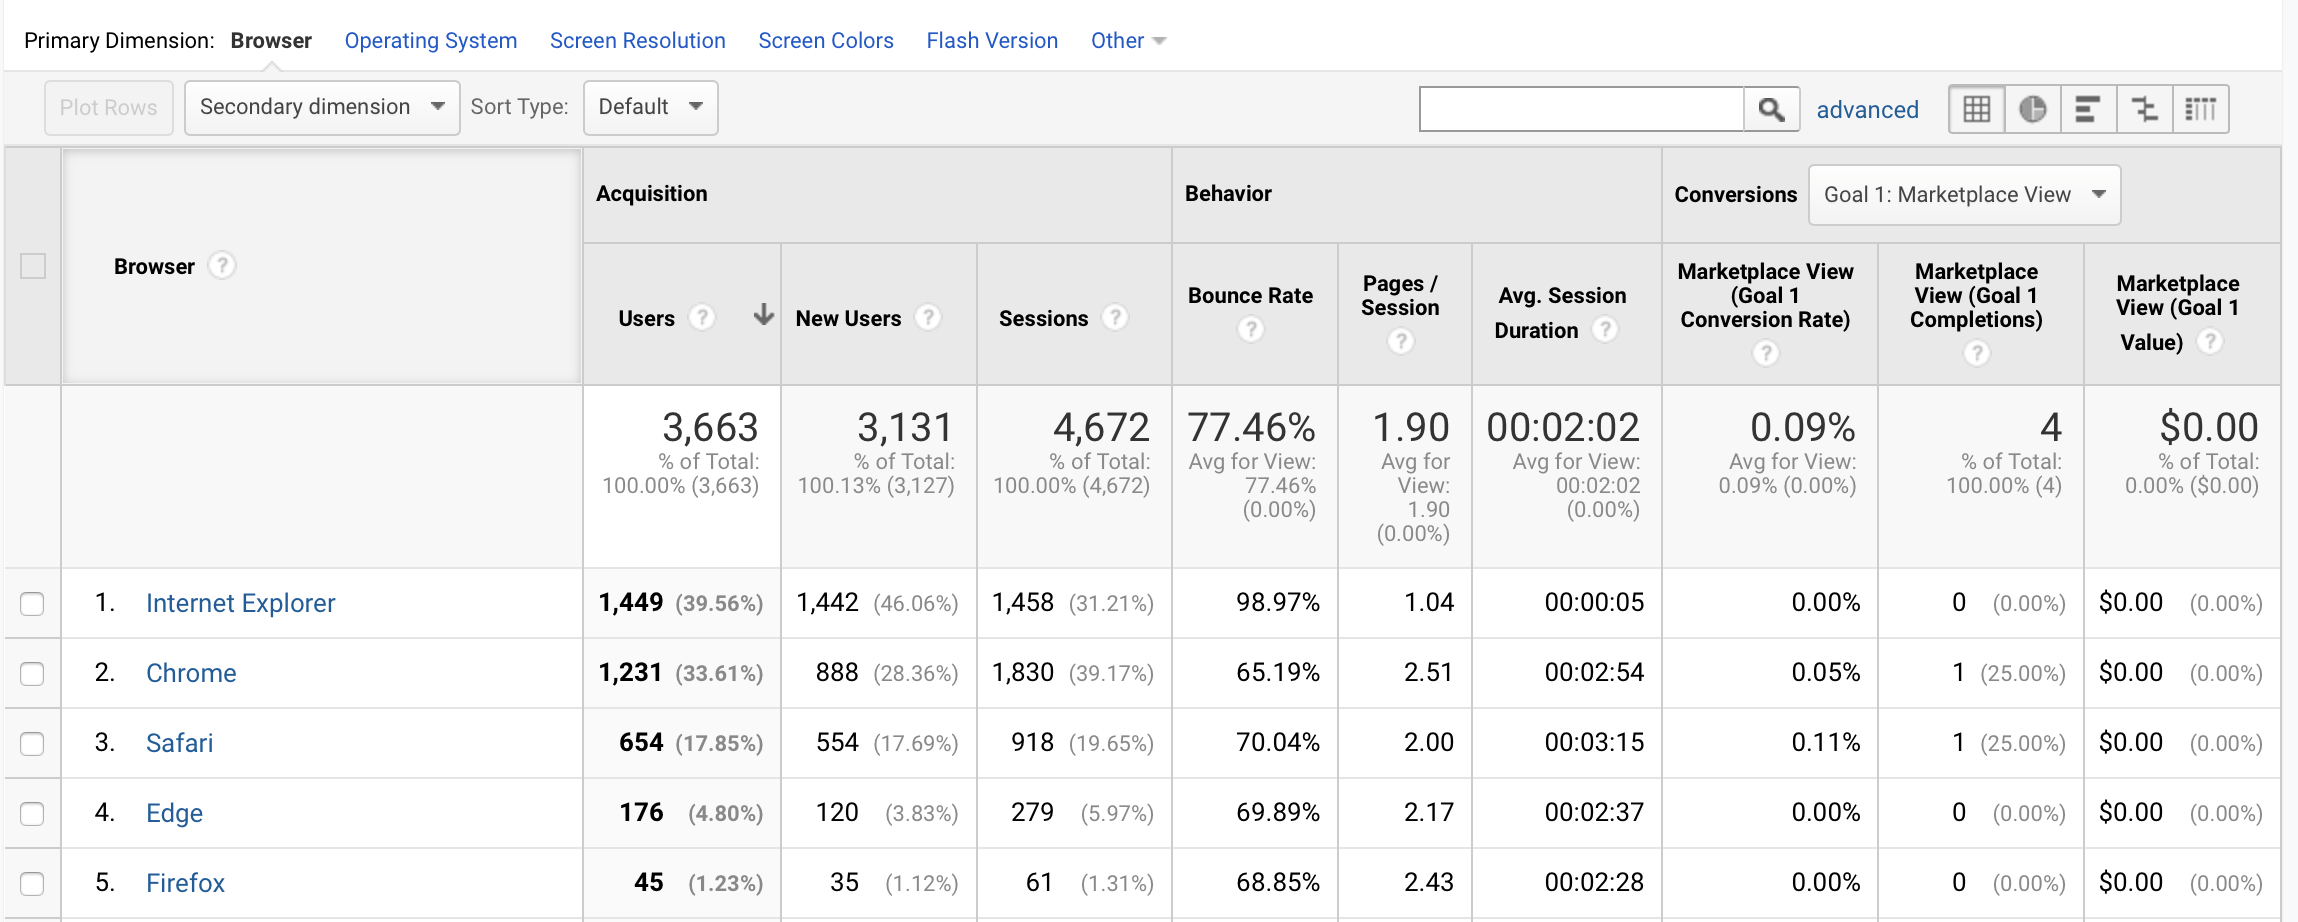
Technology
In this section, we can find out the browsers and operating systems from which users access our website: the number of sessions from each browser, page views, duration of visits, conversions, etc.
This should be taken into account when ensuring that your website is perfectly accessible in every way to users of any browser, both desktop and mobile.
By clicking on any of the browsers, you can even access further data by browser versions.
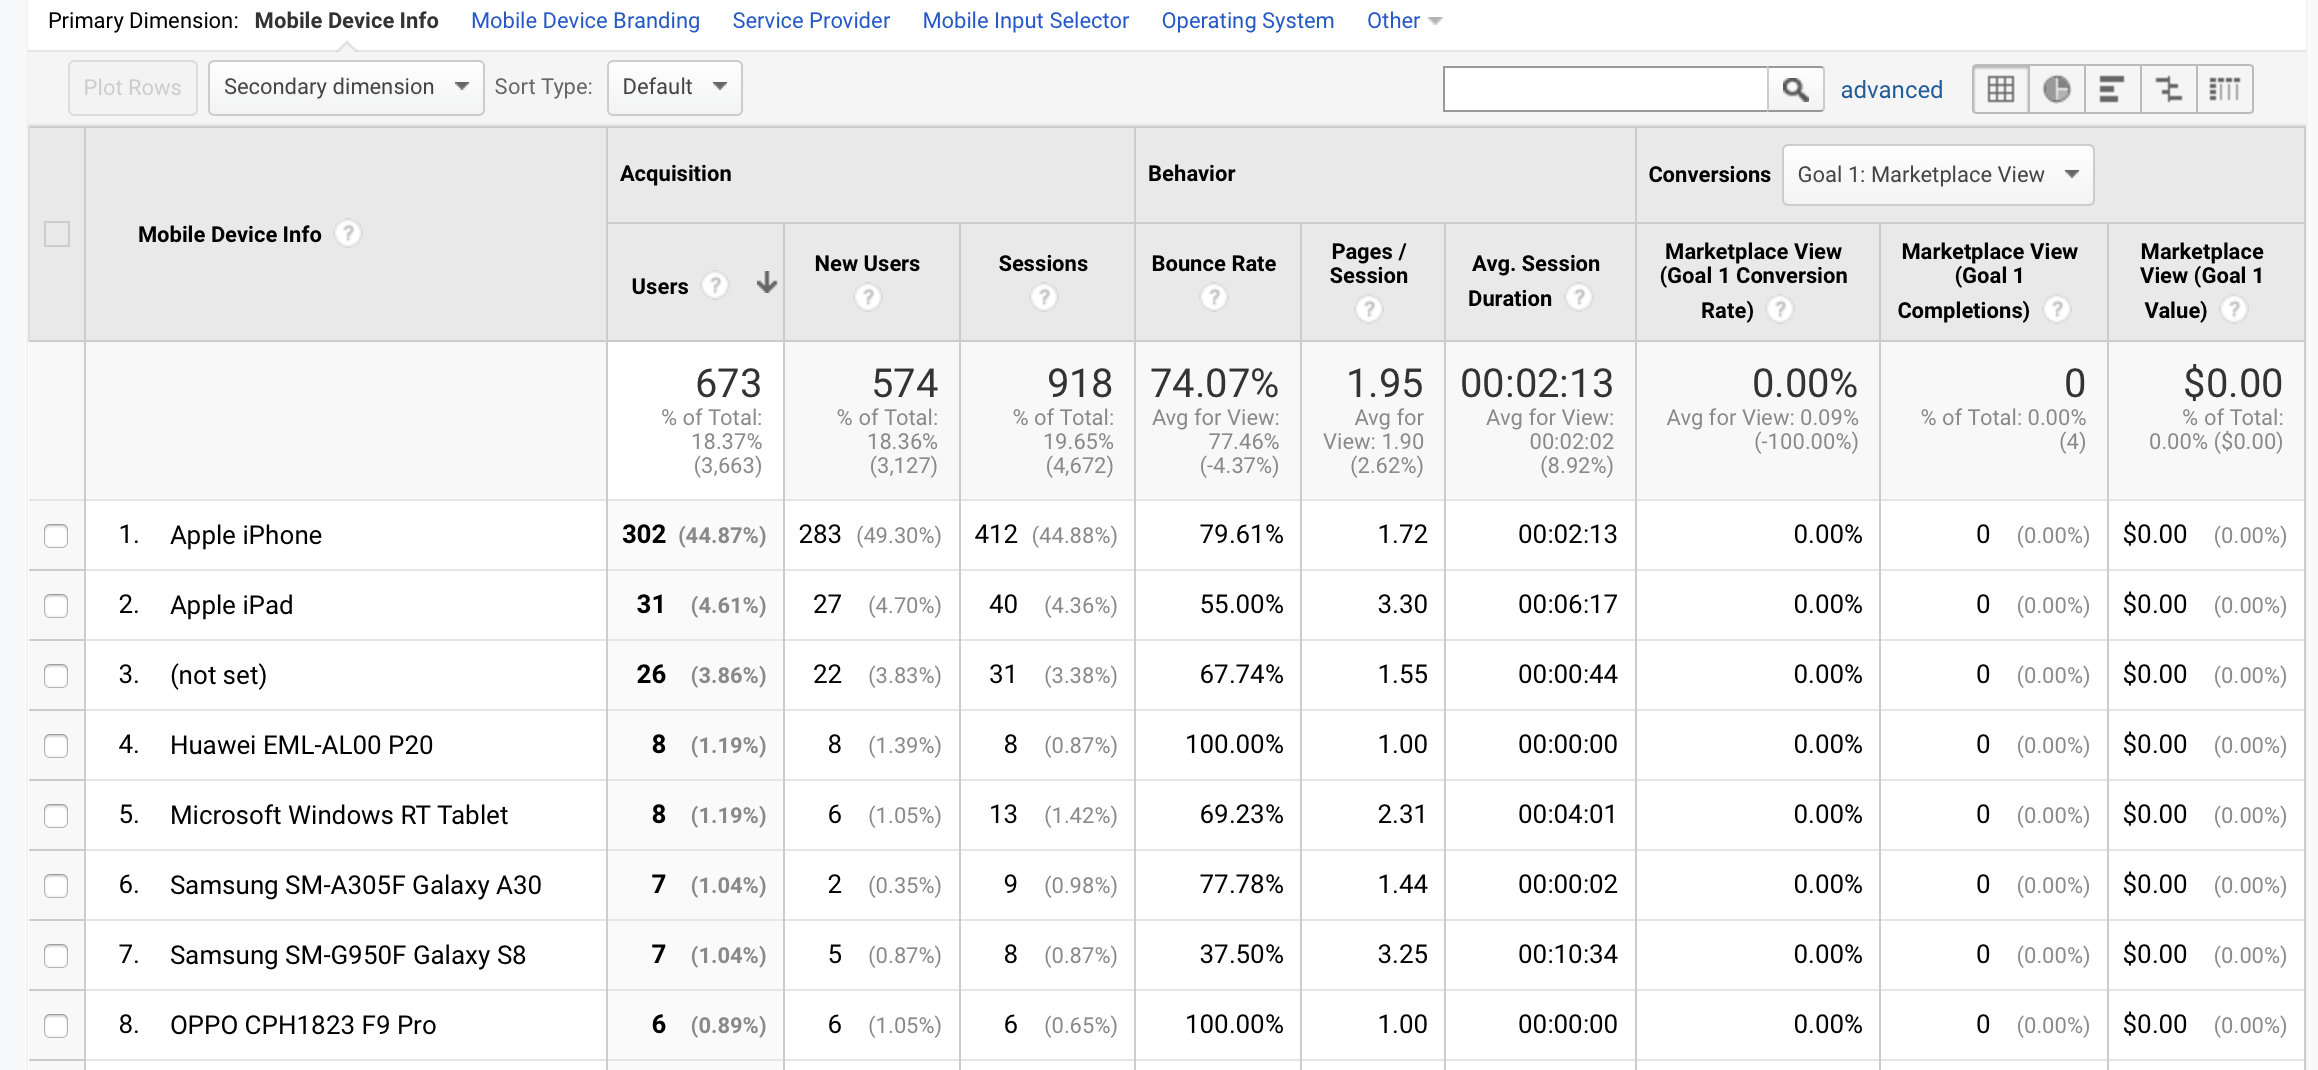
Mobile
In this section you can access the number of visits that come from different devices and find out the quality of these visits.
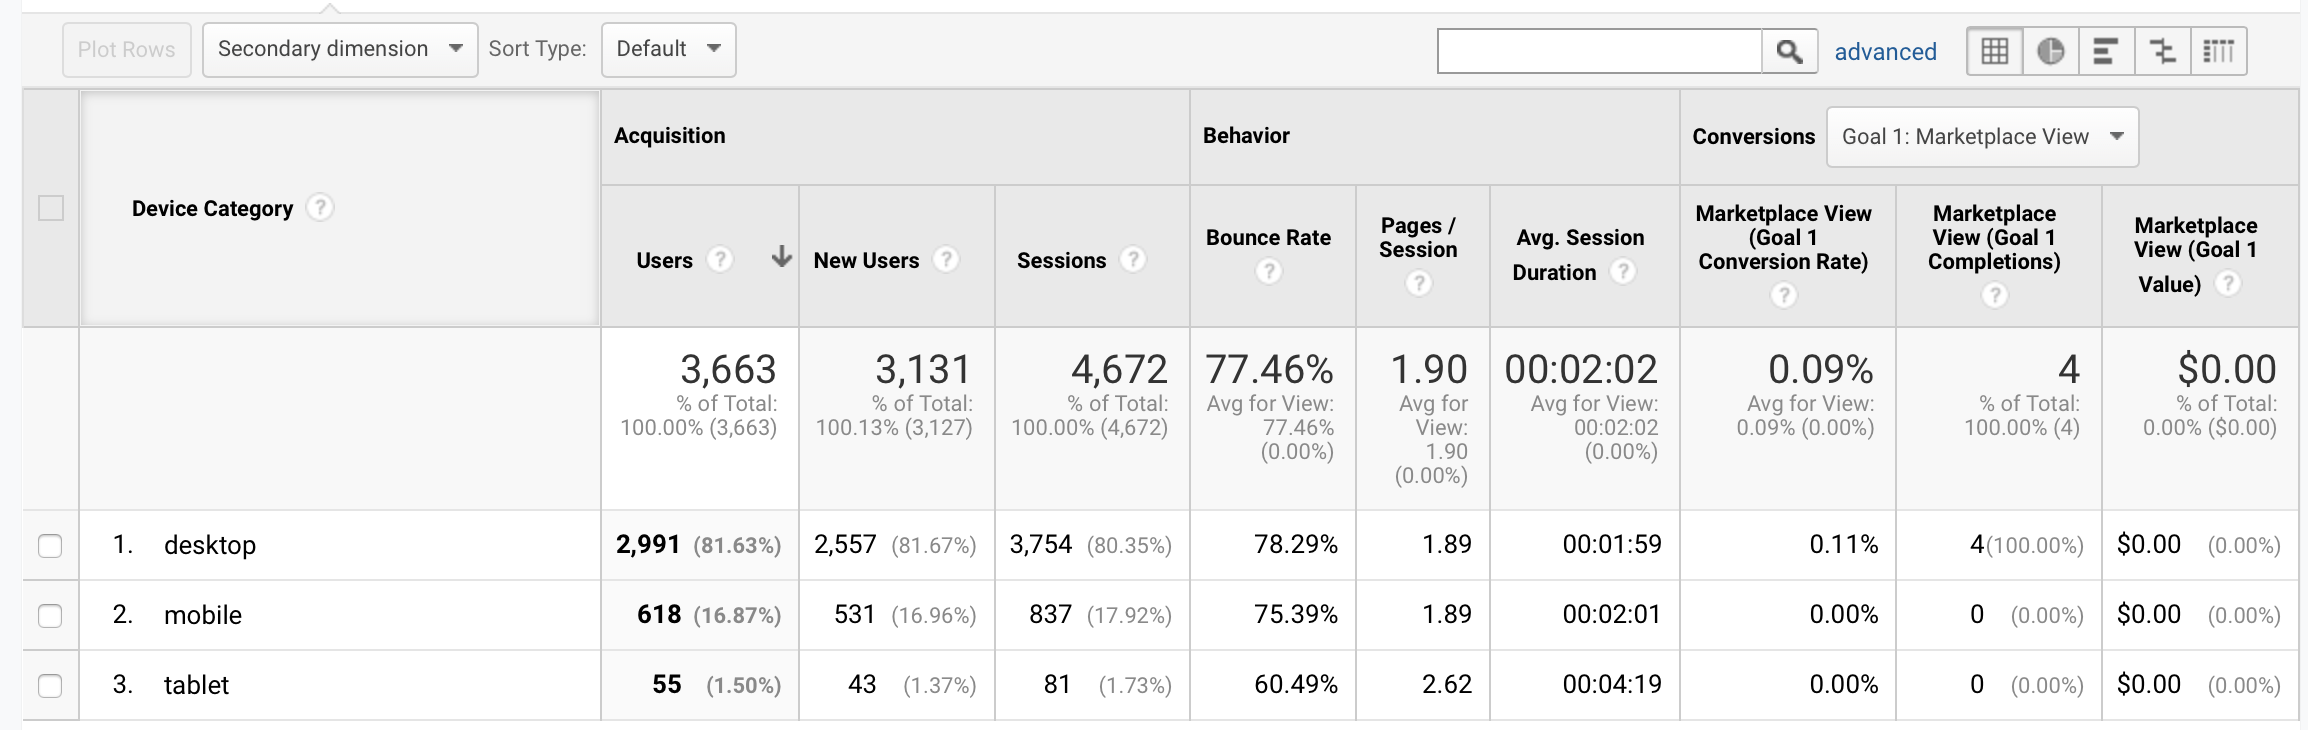
You can also look at the specific type of mobile device your users are using and discover the number of visits, their behaviour and the conversions for each of them.
Acquisition
With the acquisition report in Google Analytics, we can look at how our traffic is coming to our website and analyse the behaviour.
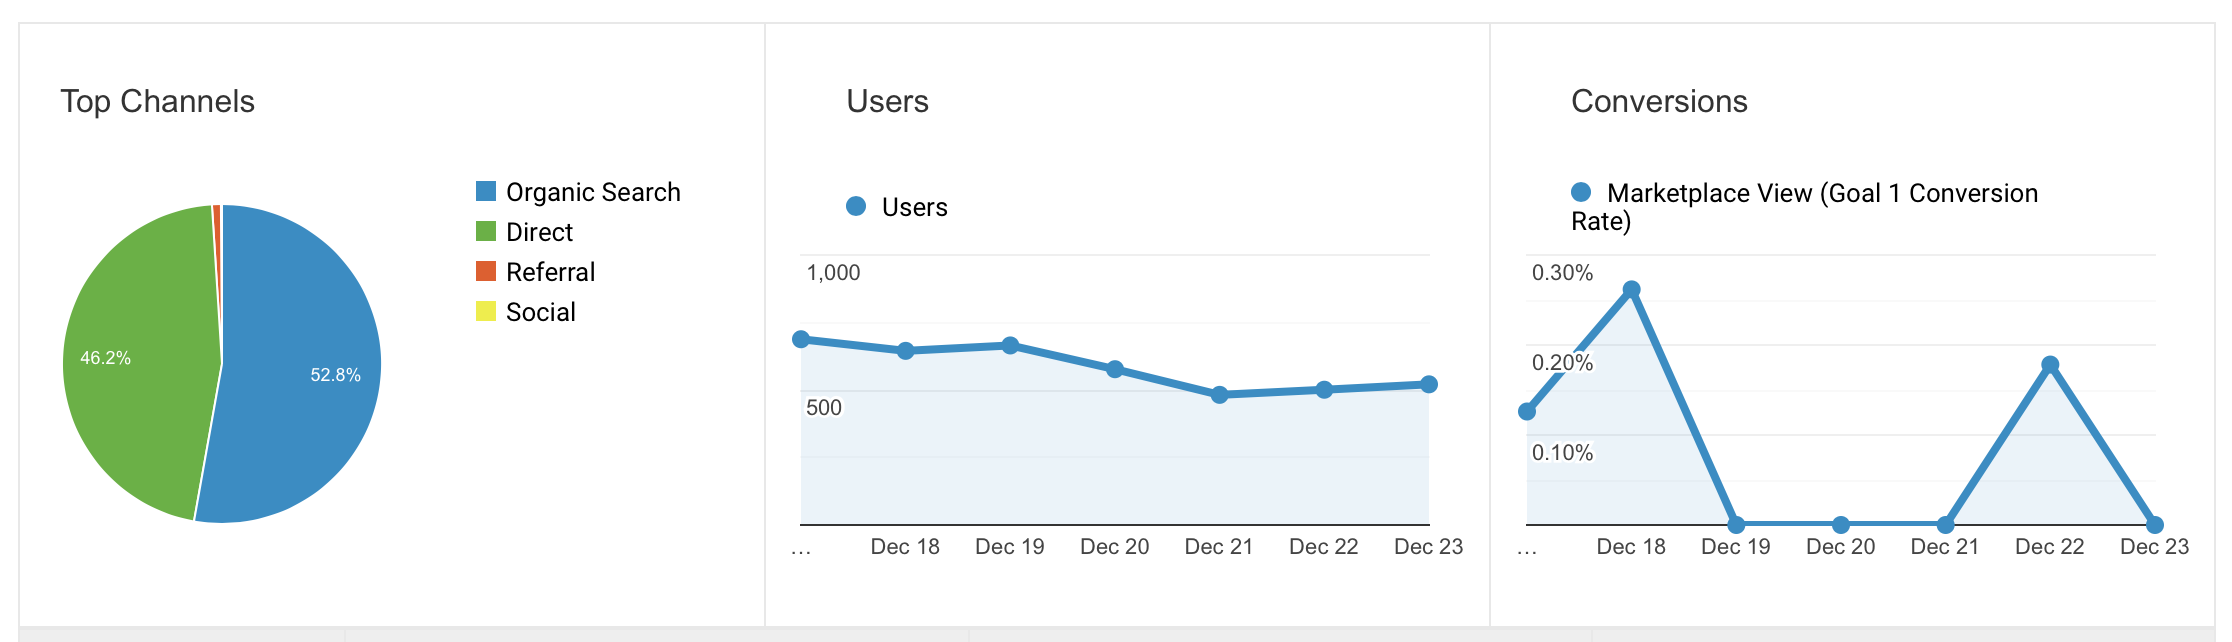
Overview
In the overview section, you are presented with a series of graphs with general information that you are able to analyse in greater depth within the acquisition subsections.
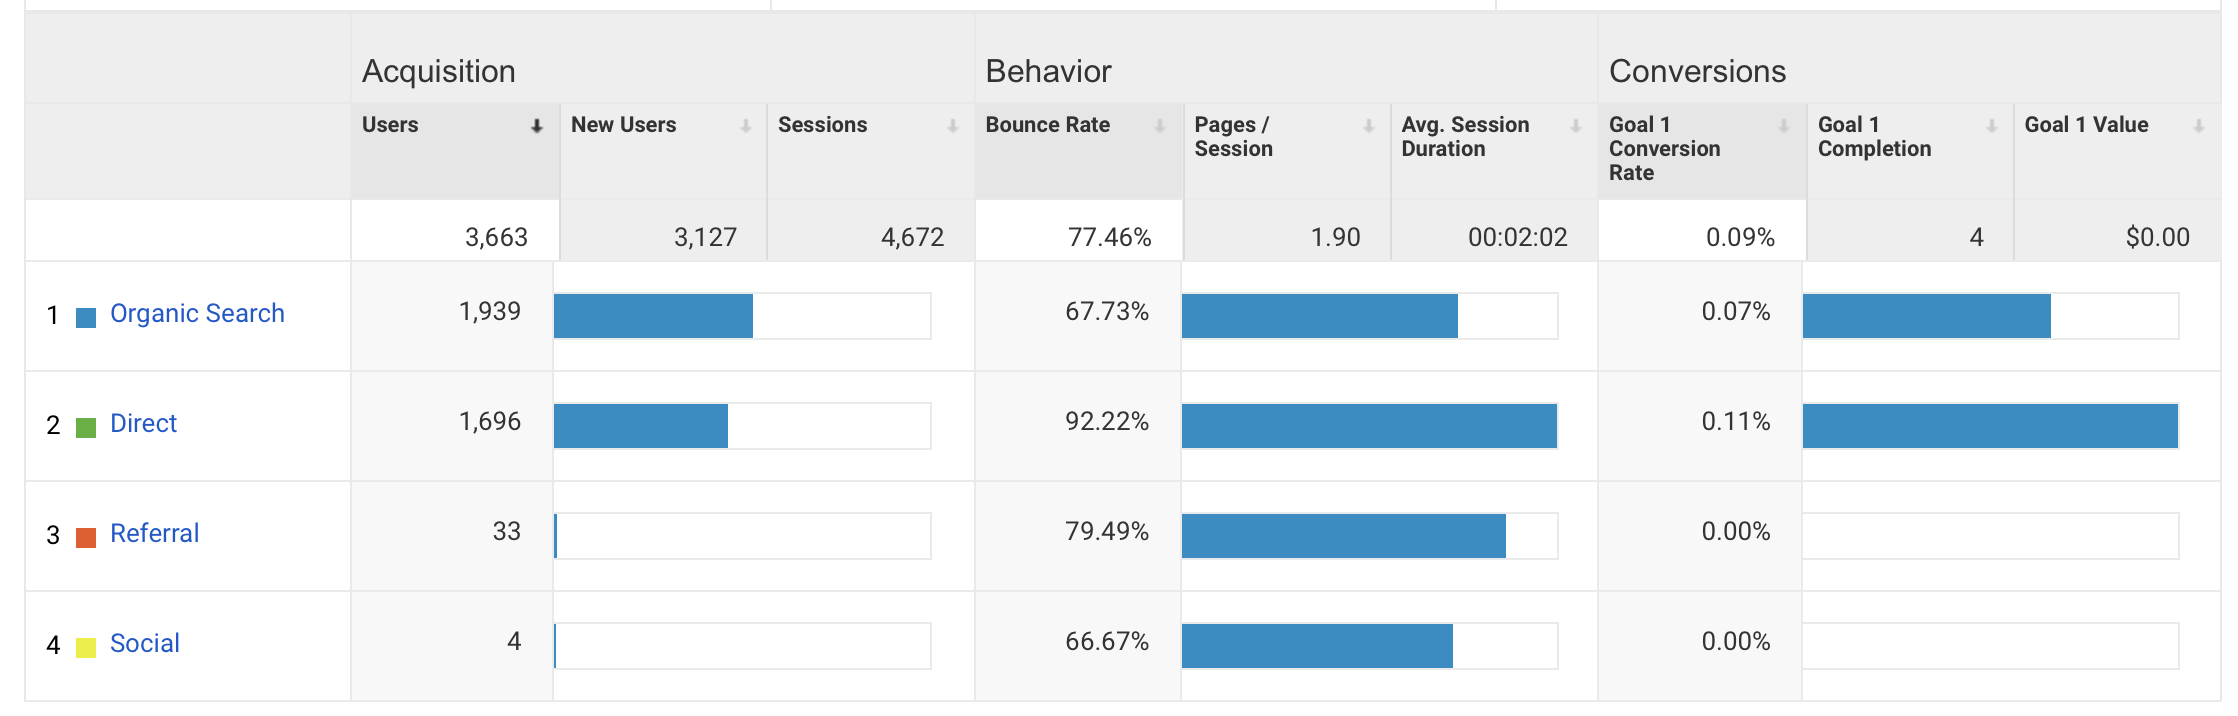
All Traffic
From here, we can filter the data of our visits by channels and obtain very valuable information on how each traffic source is working for us.
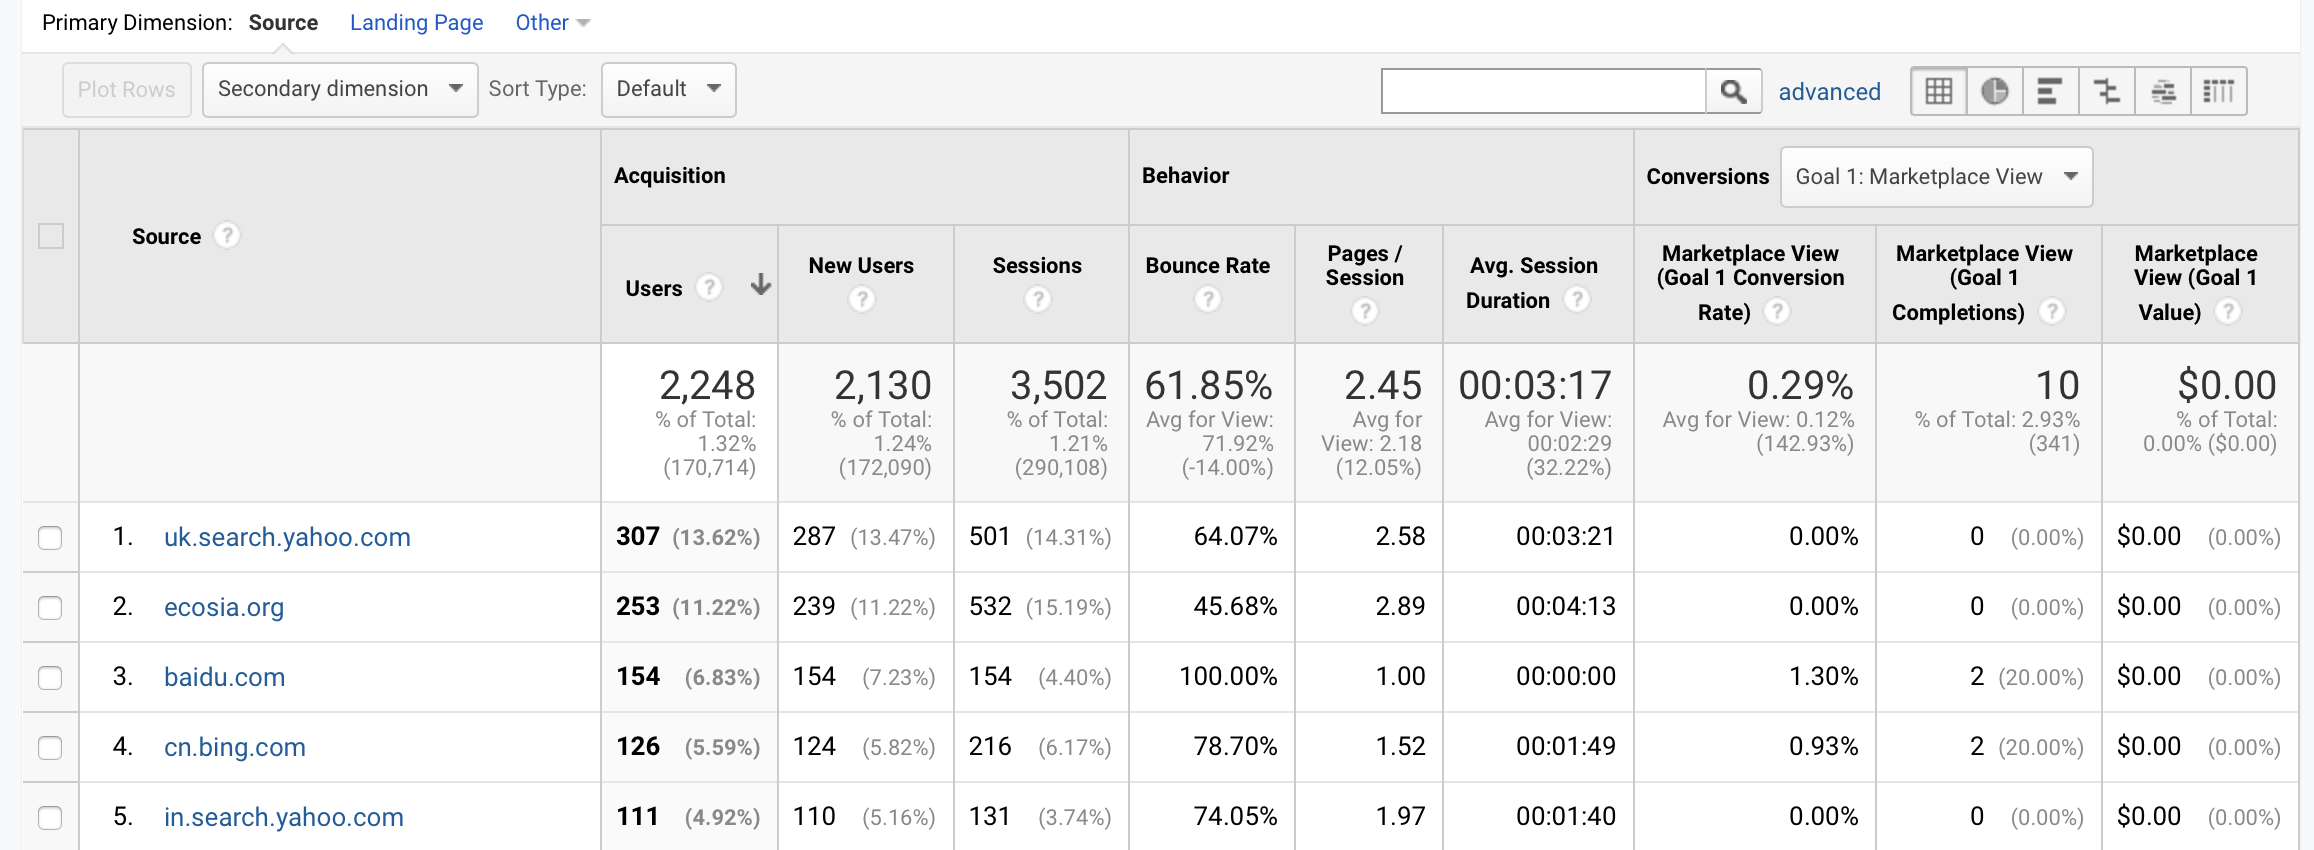
Organic Traffic
Google Analytics provides in-depth data about the organic traffic arriving from search engines, the keywords that have caused these visits, the landing pages, the exact sources of the visits (Google, Bing, Yahoo, etc.) and the behaviour of these organic visits within our website (average session duration, bounce rate, etc.).
Regarding the keywords, we see that the vast majority are listed as “not provided” or "not set". But if we select the metric "Landing page" we can access the landing pages of these organic visits.
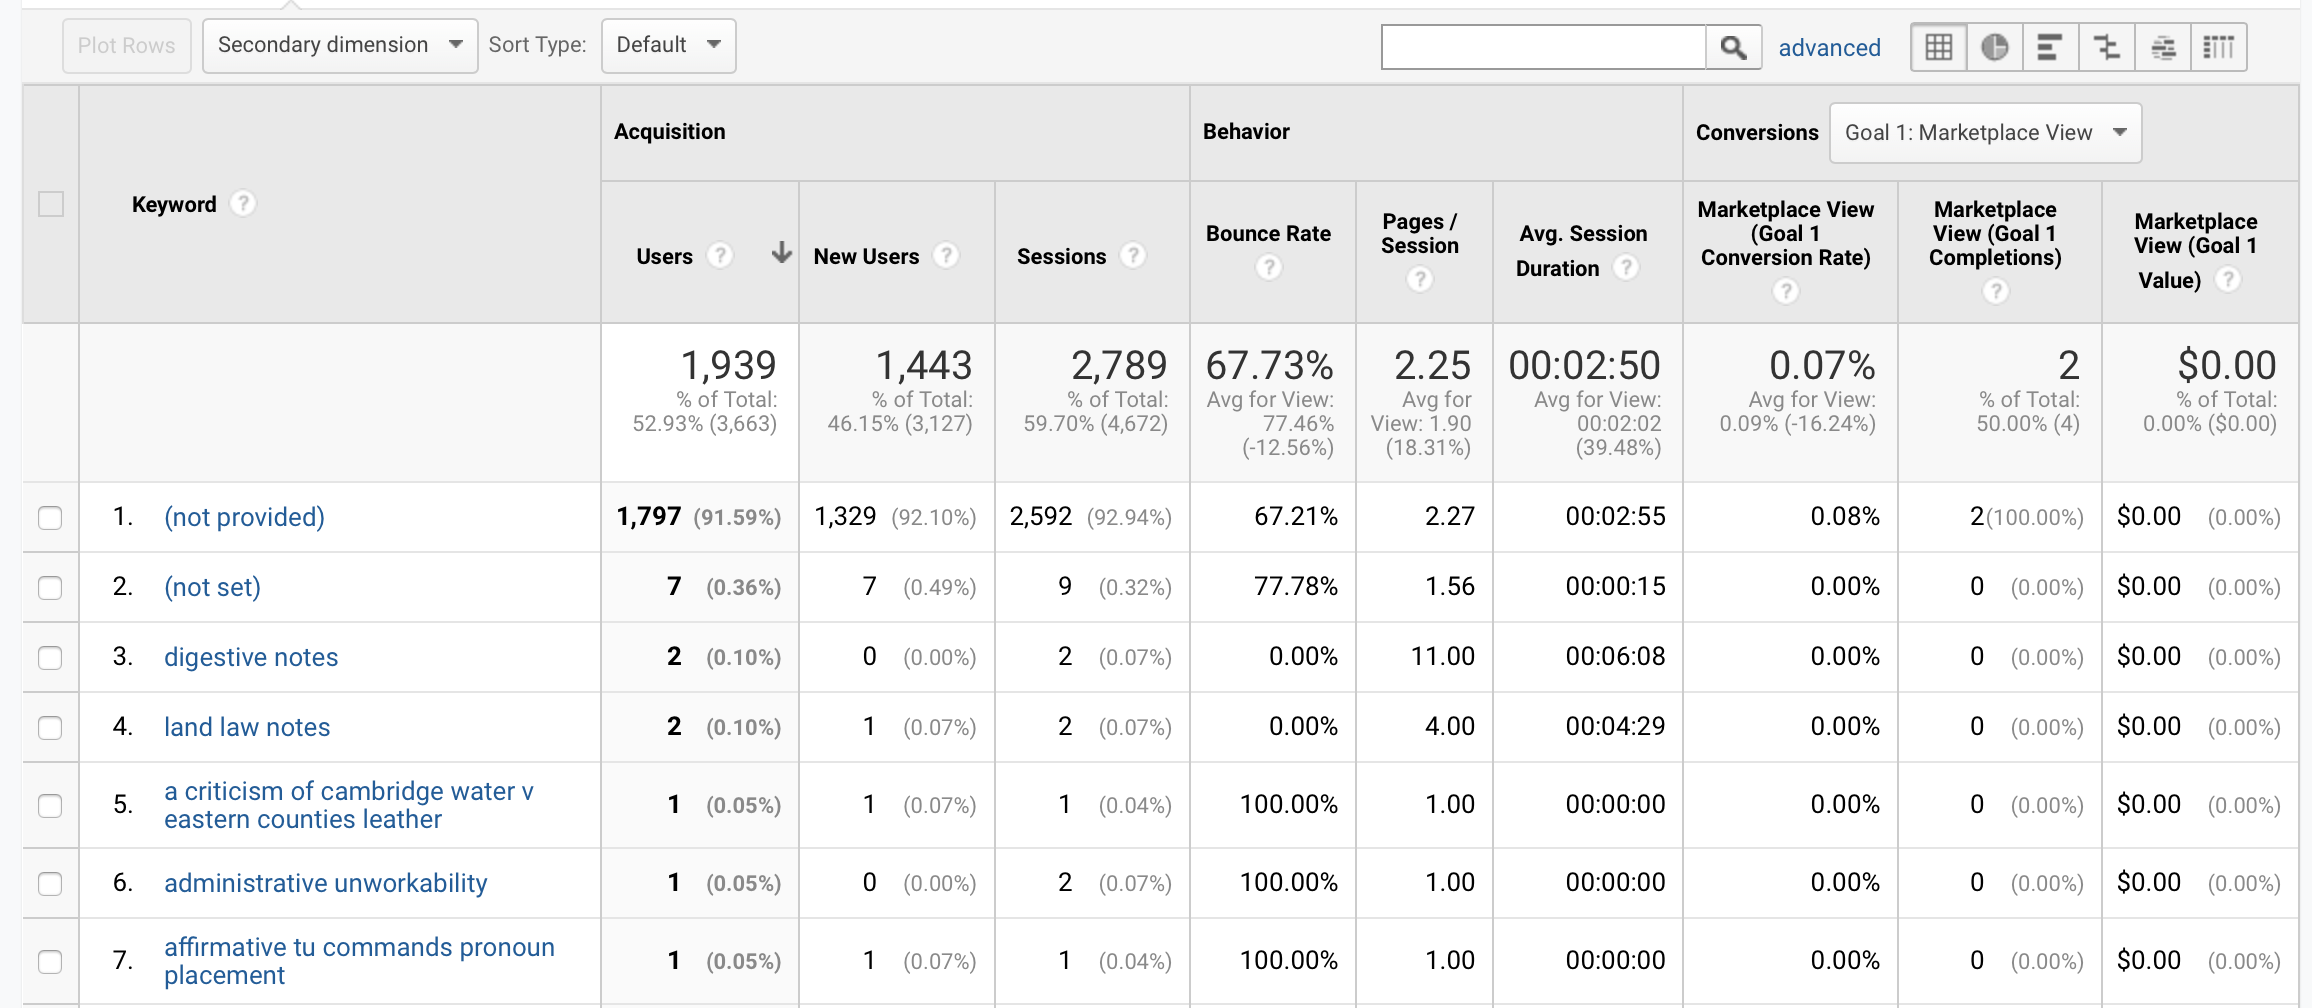
Google Console would give you much more information about keyword information, which we have written an article about to help you.
Direct Traffic
From this section we are able to see the traffic we receive directly. That is, we can see the URLs users have entered directly into their browser to land on your page. And, as per usual, we can see the behaviour of these visits.
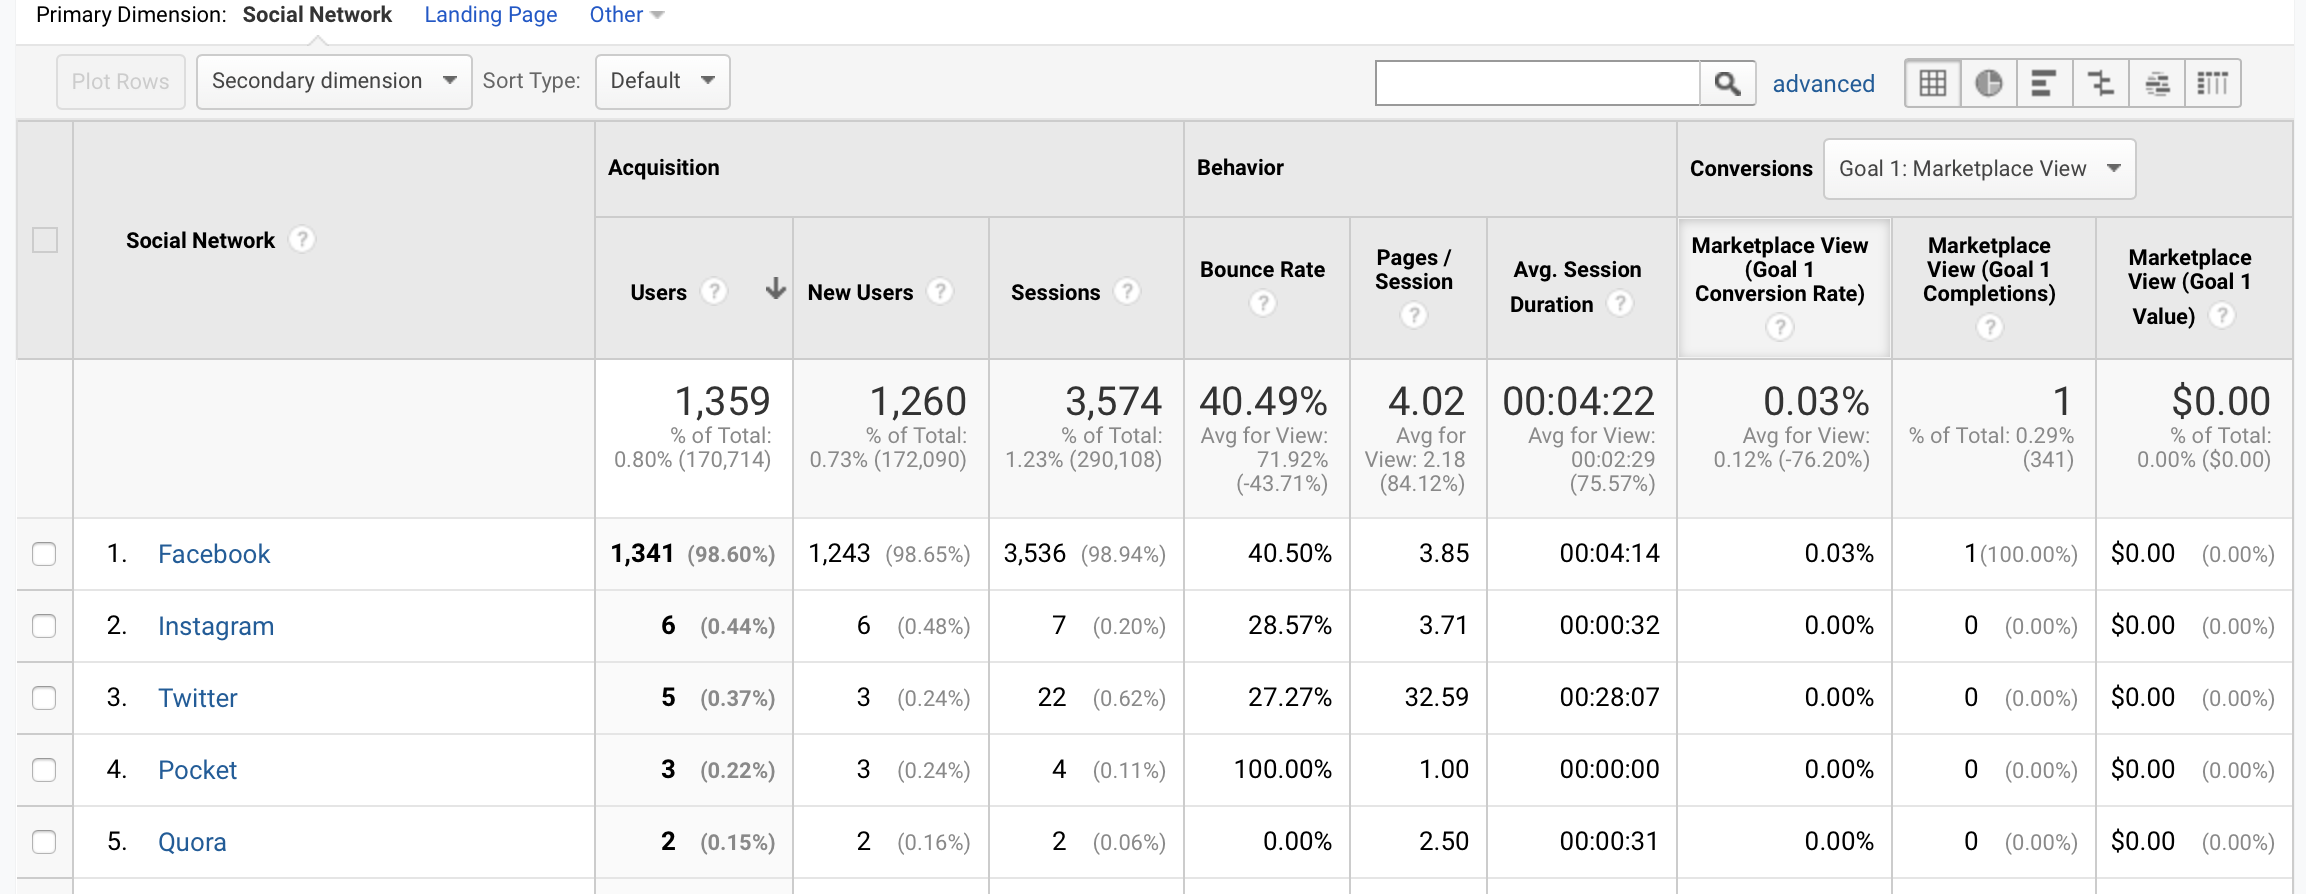
Social Traffic
This section shows us all the traffic we are receiving from social networks within a period of time. It provides us with all the information on the number of sessions and the behaviour of these visits segmented by each network or social media.
Referral Traffic
Referral traffic are the visits that come to us from the references with links that have been made to us on other websites or social platforms. The tool provides us with all the data of these visits, their evolution and gives us the segmented information of the visits and their behavior for each one of the reference sources that have brought us traffic.
Google Ads
I will soon make a full guide on Google Ads, but for now all I will say is that if you link your Google Ads Account with your Google Analytics account, you can access all the data from the visits that have come from your paid campaigns, and see the user behaviour, clicks, impressions, conversions, keywords, and more.
In other words, you can see all the necessary information to know how your campaigns are working for you and so you can assess their performance and improve them.
Google Search Console
I've already briefly mentioned the Google Search Console and said that this free tool, among other things, gives you far more extensive information about the keywords that are driving traffic to your website.
In my complete guide of Search Console I tell you step by step how this tool works and all the advantages it can bring to you and your website.
If you link your Google Search Console account with Google Analytics, which I highly recommend you do, you can access web analytics reports that include information provided by Search Console.
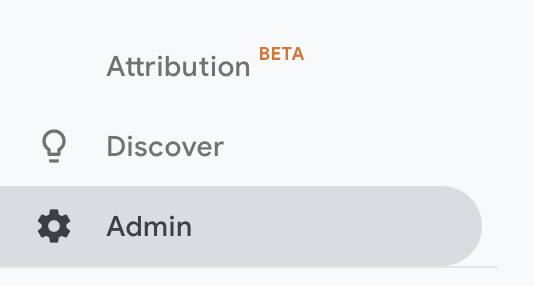
Once you have created your Search Console account, to link the accounts access the Google Analytics Admin menu from the left sidebar.
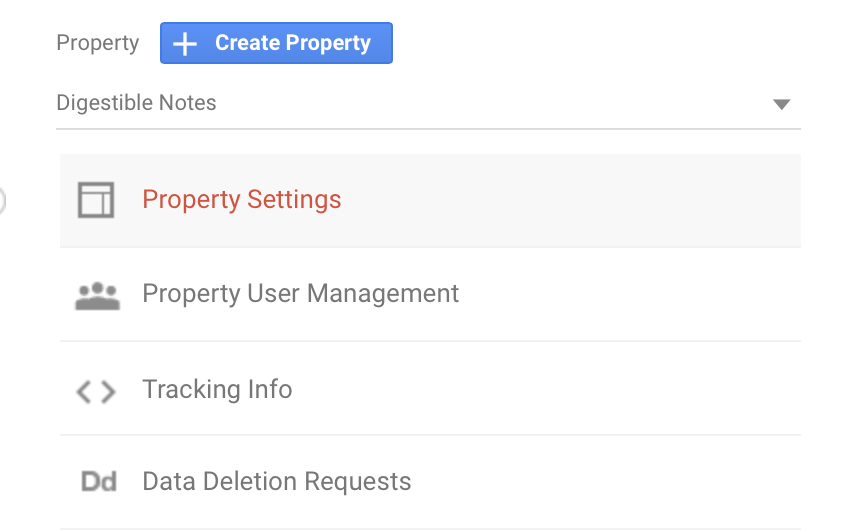
Click on the 'property settings':
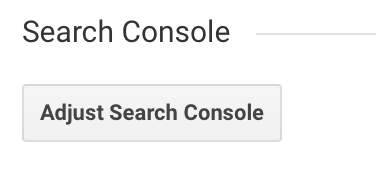
Go down this page until you find the "Search Console" option and click on the "Adjust Search Console" button.
Social Media
In this section, Google Analytics groups all the information related to the traffic we receive from social networks
Google Analytics also provided us with information on our social traffic in the 'channels' section, but here it expands it and offers it to us grouped in a more specific web analytics report that includes more metrics and parameters.
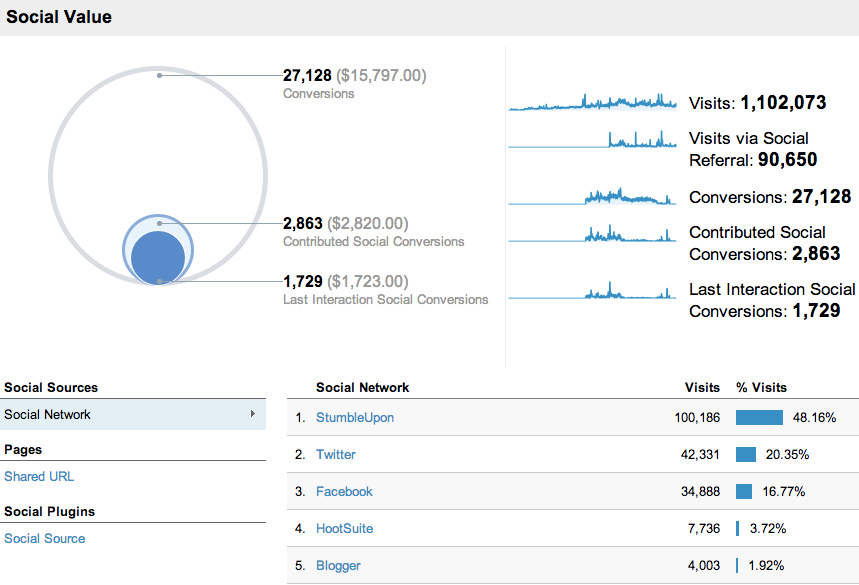
From this report, you can measure and analyse your social impact, obtaining information on:
- The social sources from which visits arrive
- Landing pages from social networks
- Conversions: the performance of your social media activity
- User flow: the behaviour patterns of users accessing from social media
Behaviour
Do you want to know how your users behave when they browse your website? Where do they enter, where do they exit, what content is generating the most visits, what content is working worst for you?
All this and much more is what we can learn through the behaviour analytics report.
Overview
In the overview section, we see the general information on the behaviour of users on our website.
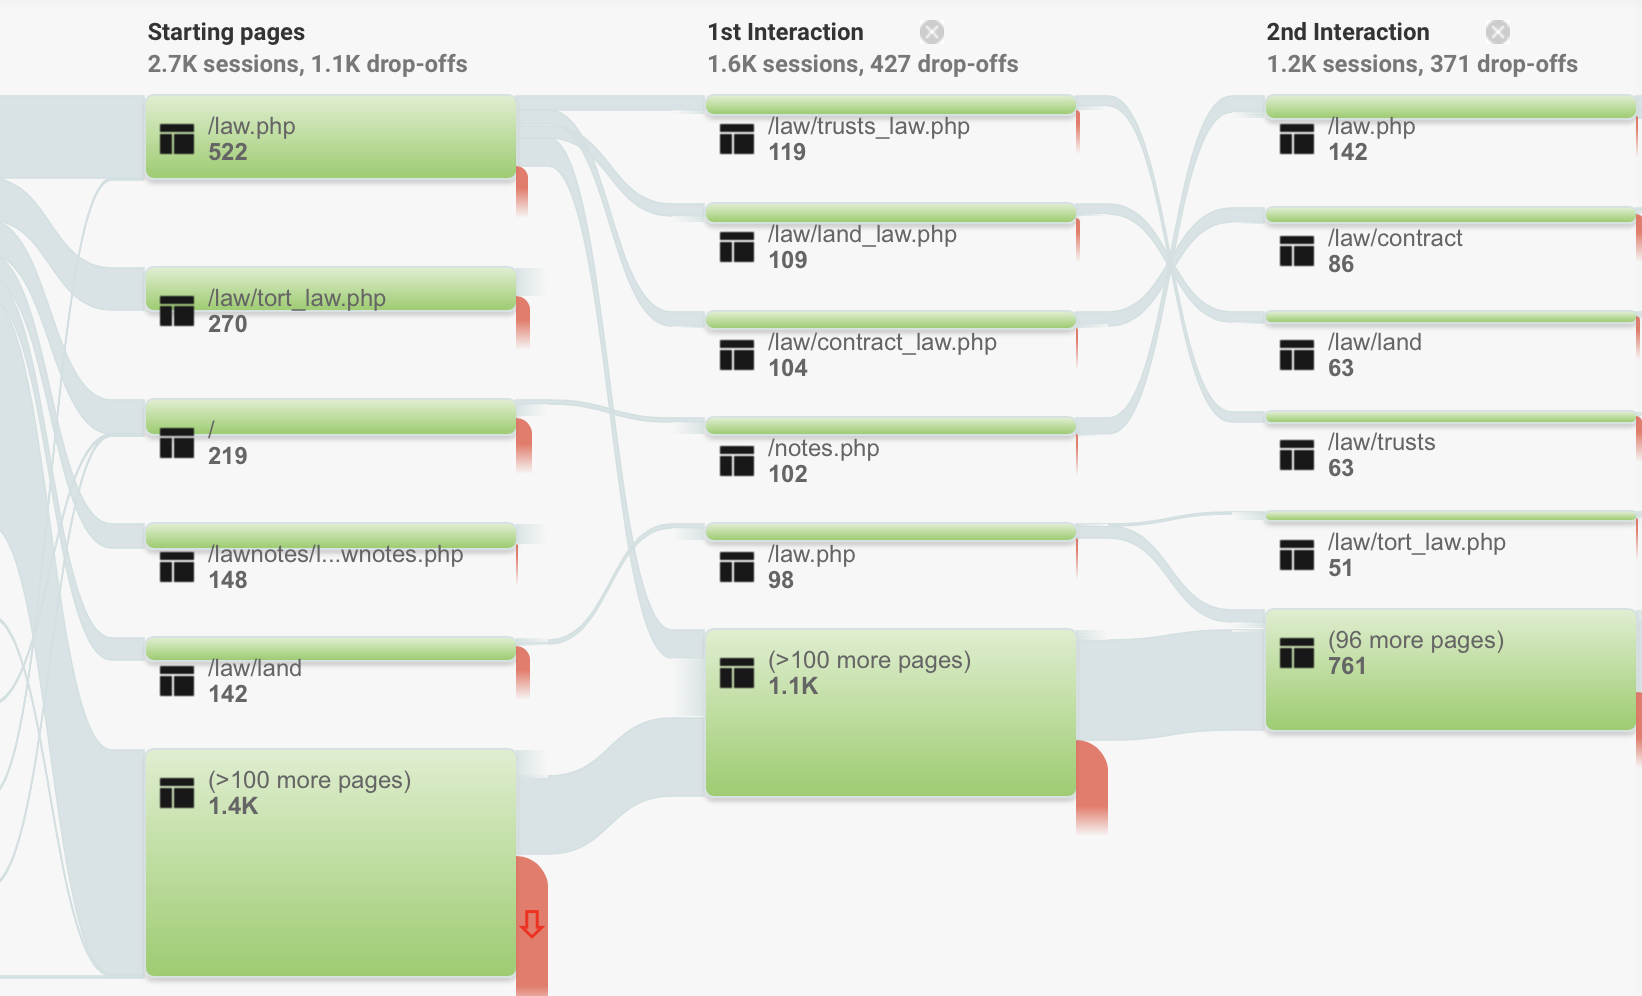
Behaviour Flow
Here we can see a map that represents the behaviour of users from when they enter until they leave our website: what pages they have accessed, which they have continued browsing, and which pages they have left the website.
In other words, the map shows us the different routes that users have followed. By clicking on the arrows either side of the house icon, we can enlarge the map and access the number of dropouts after the first interaction, the second, etc.
Site Content
In this section, we can access the segmented traffic data and the behaviour on all the URLs of our website.
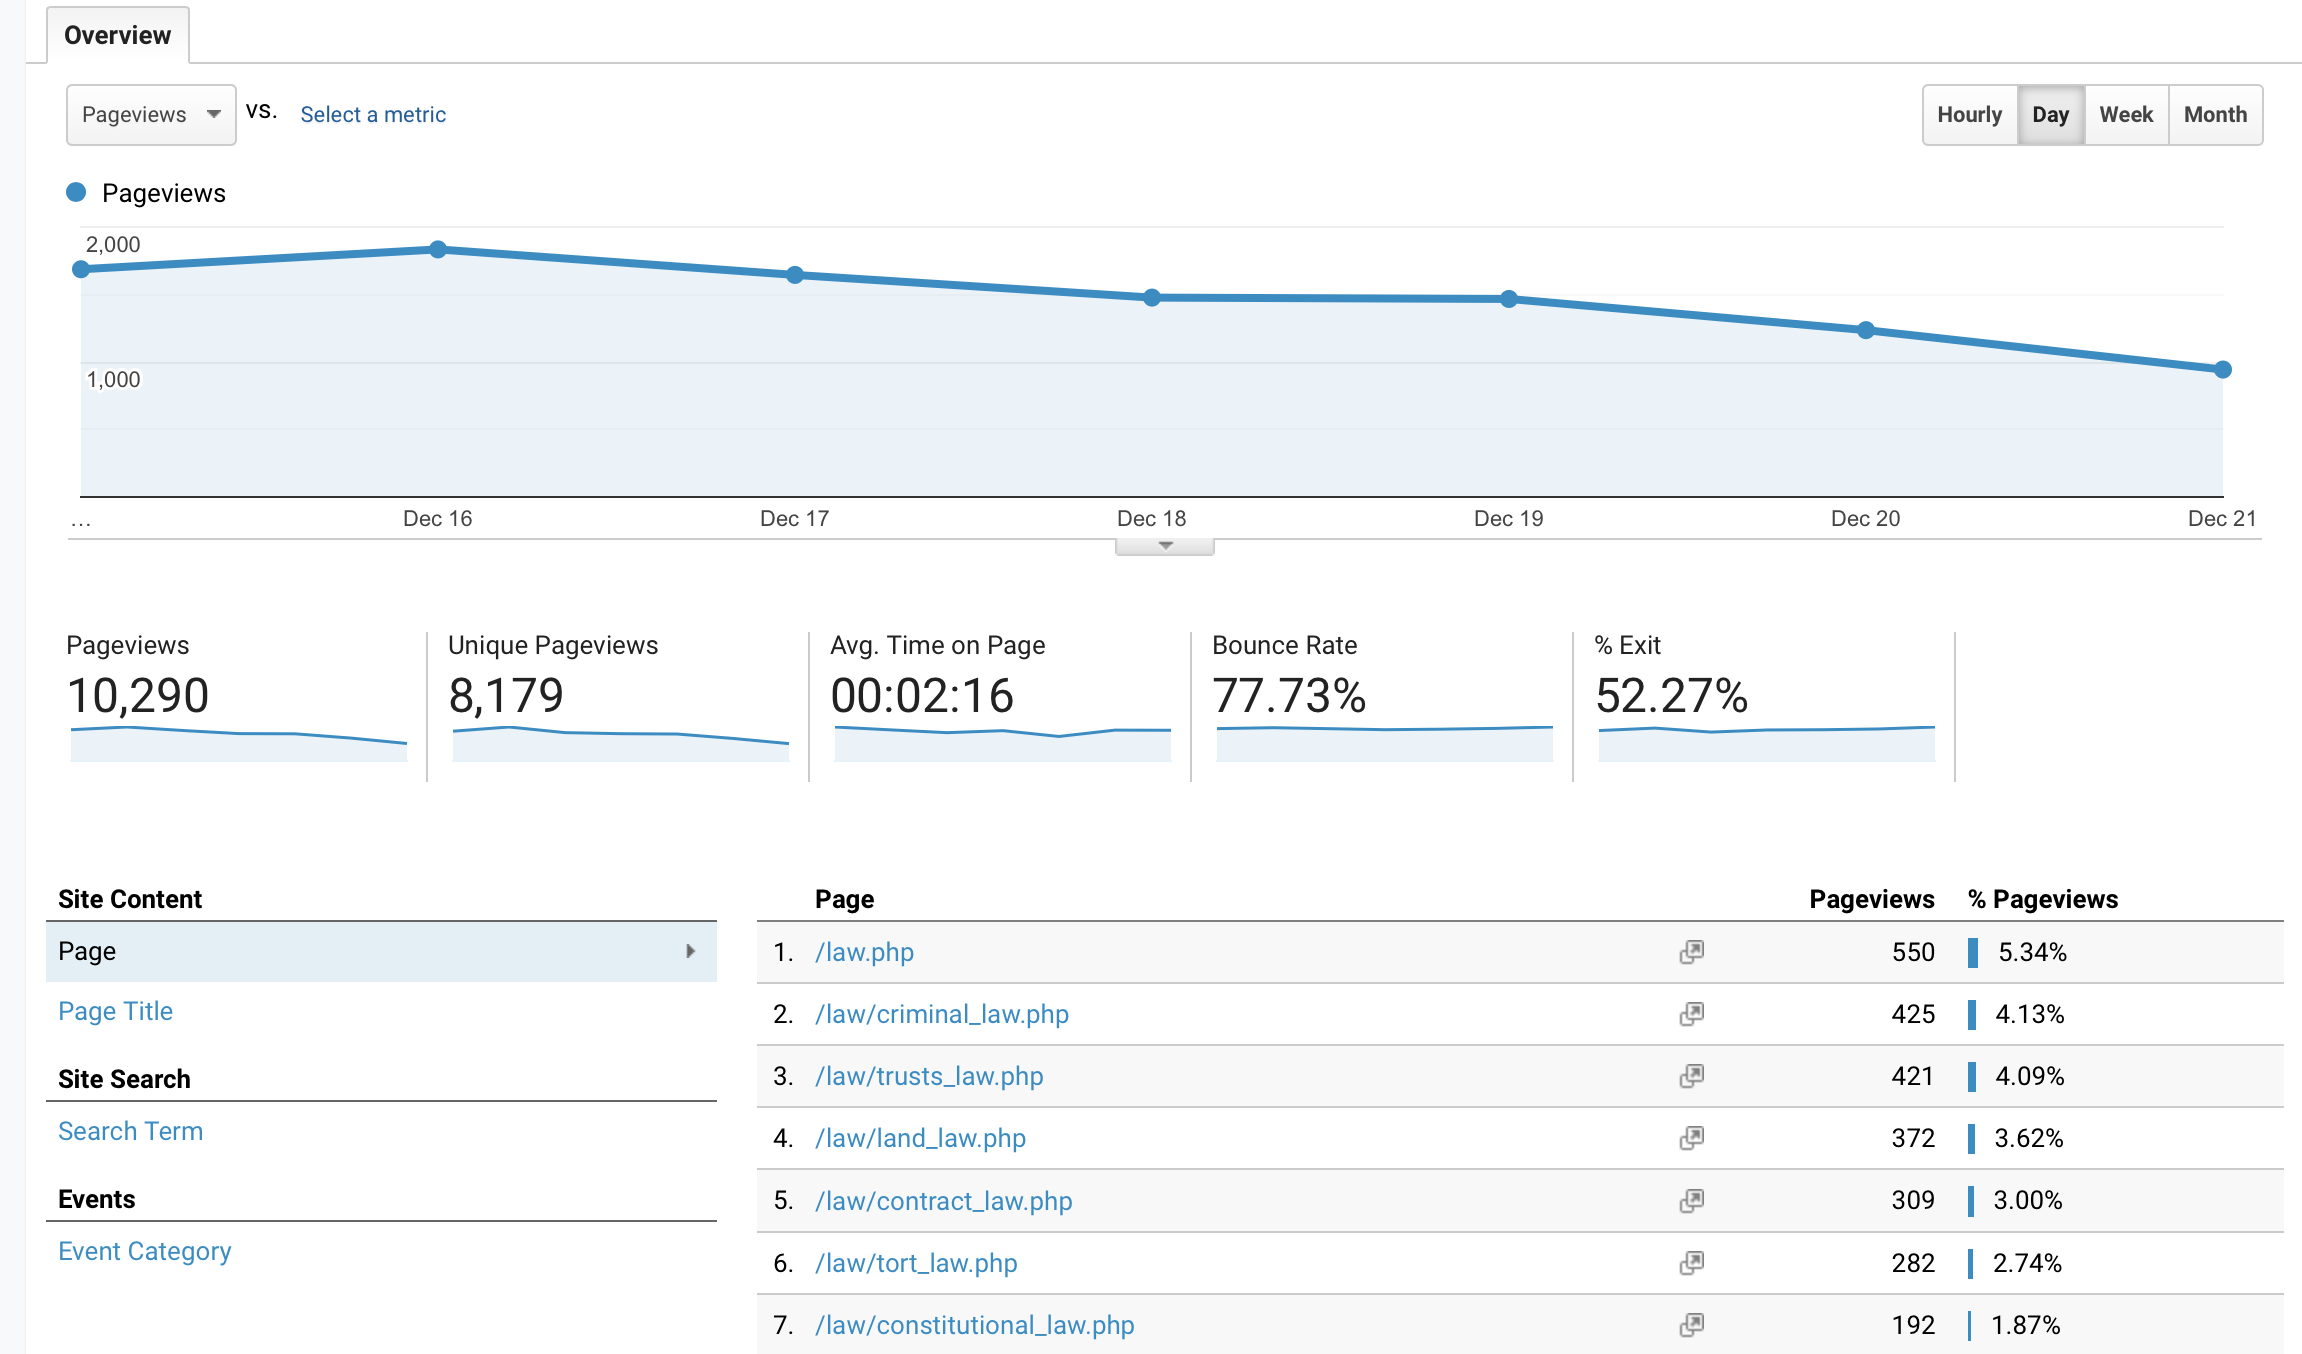
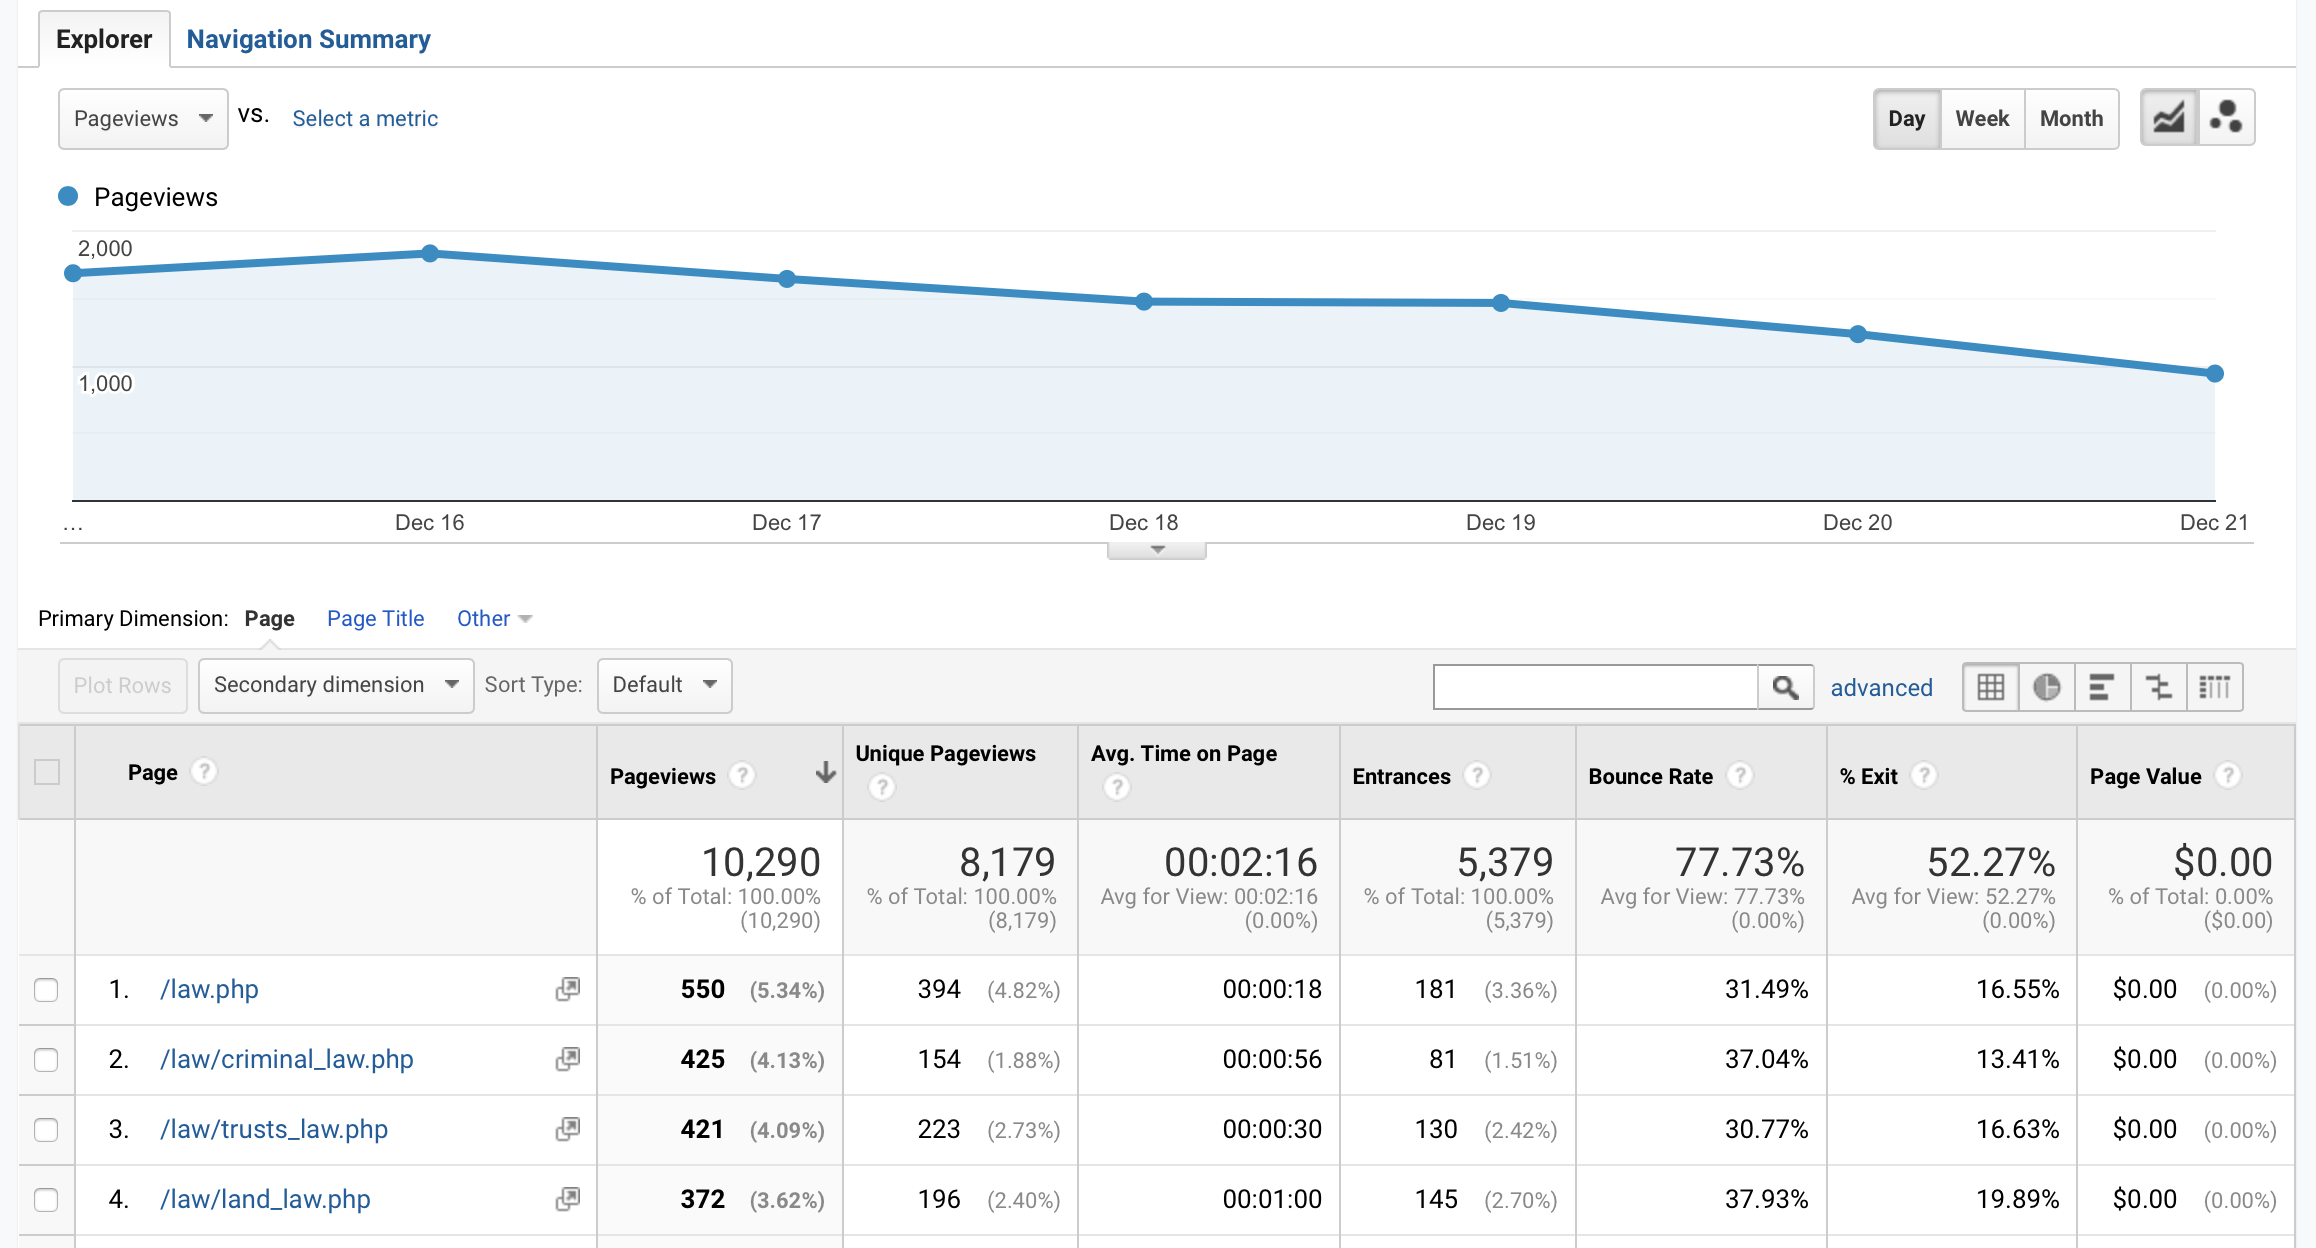
All Pages
Here we have a list of all the pages of our website that have received visits, ordered from highest to lowest traffic volume, with the following data given from each URL:
- Number of visits per page
- Number of unique page views
- Average time on the page
- Entrances: number of times that users have started their sessions on that specific page
- Bounce Rate: percentage of sessions that have started and ended on the same page
- Exit percentage: percentage of user exits from each page
- Page value: average value of each page (in case you have set a goal and have given it a value)
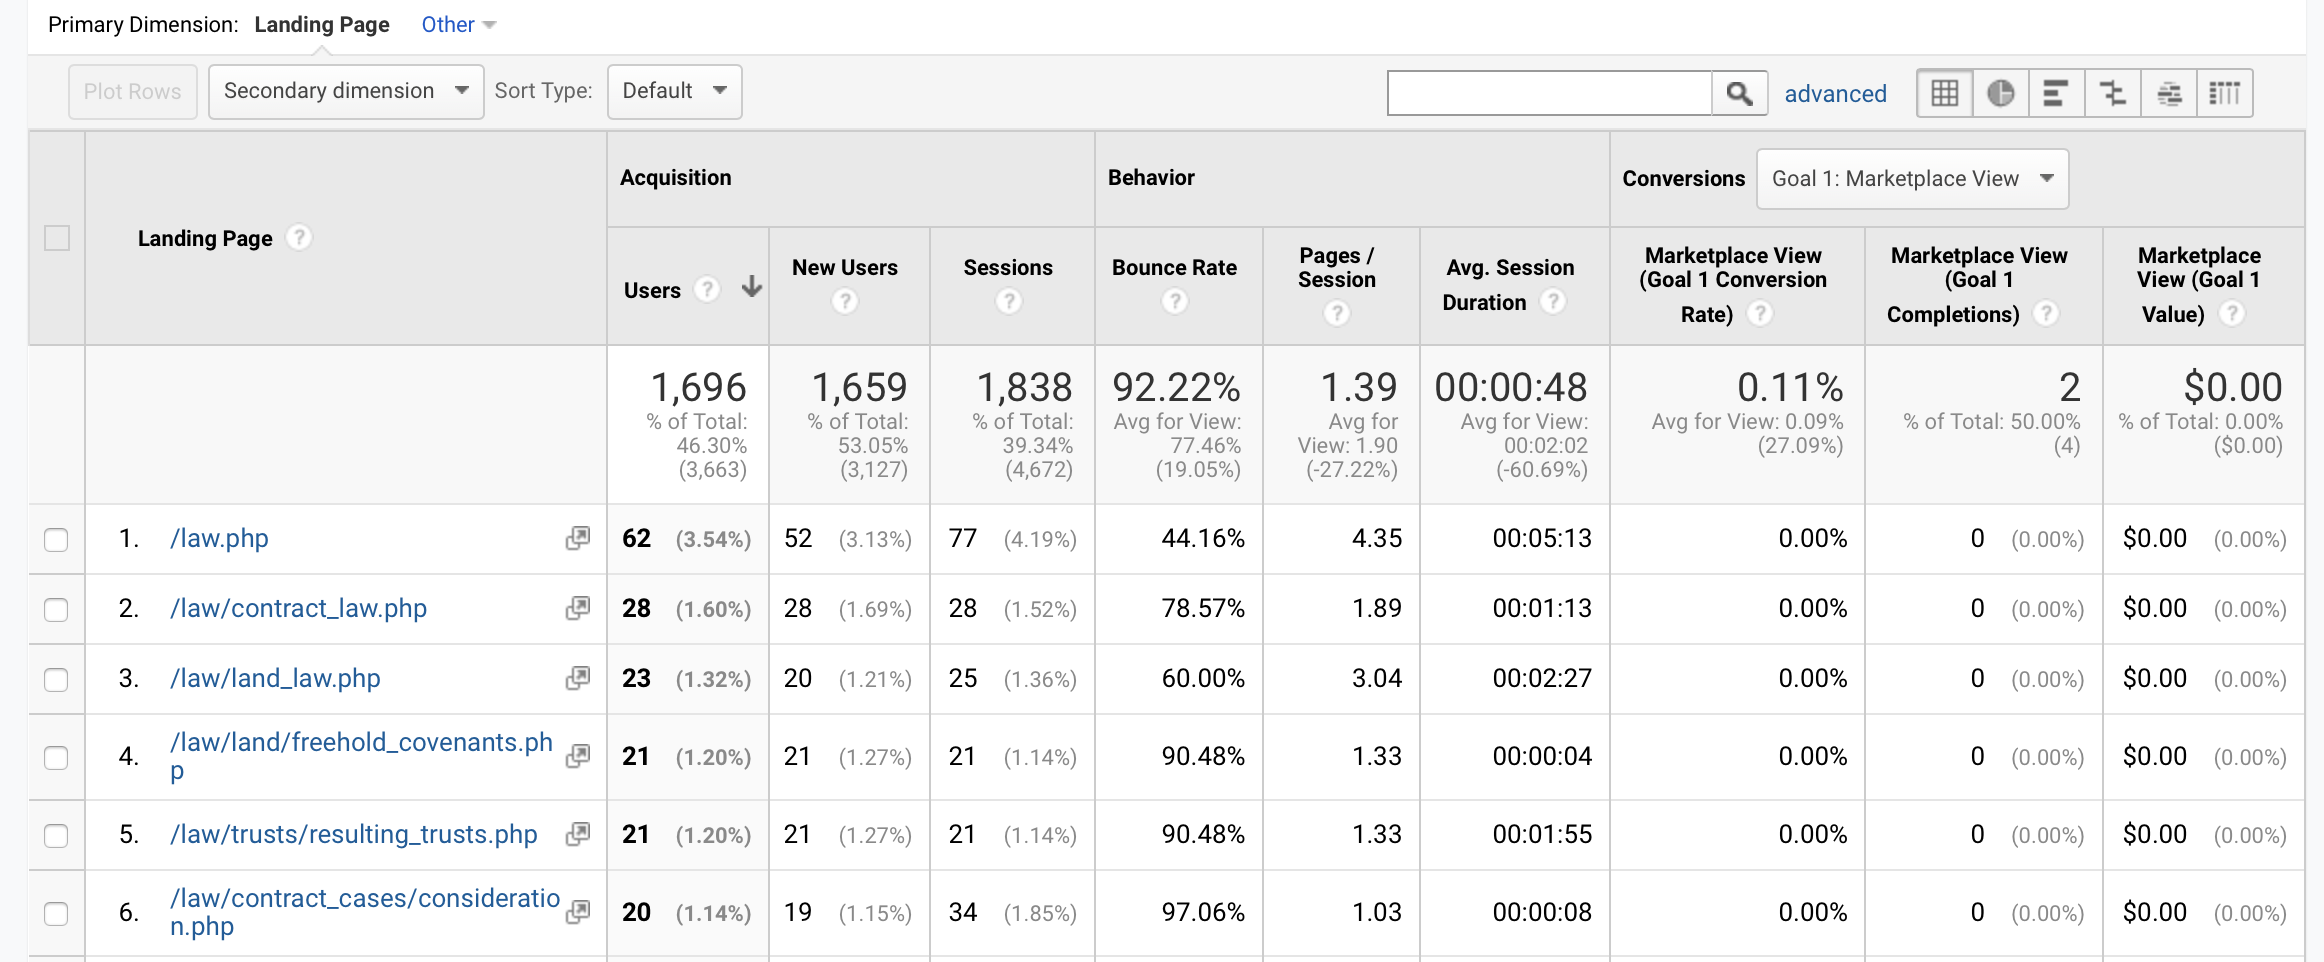
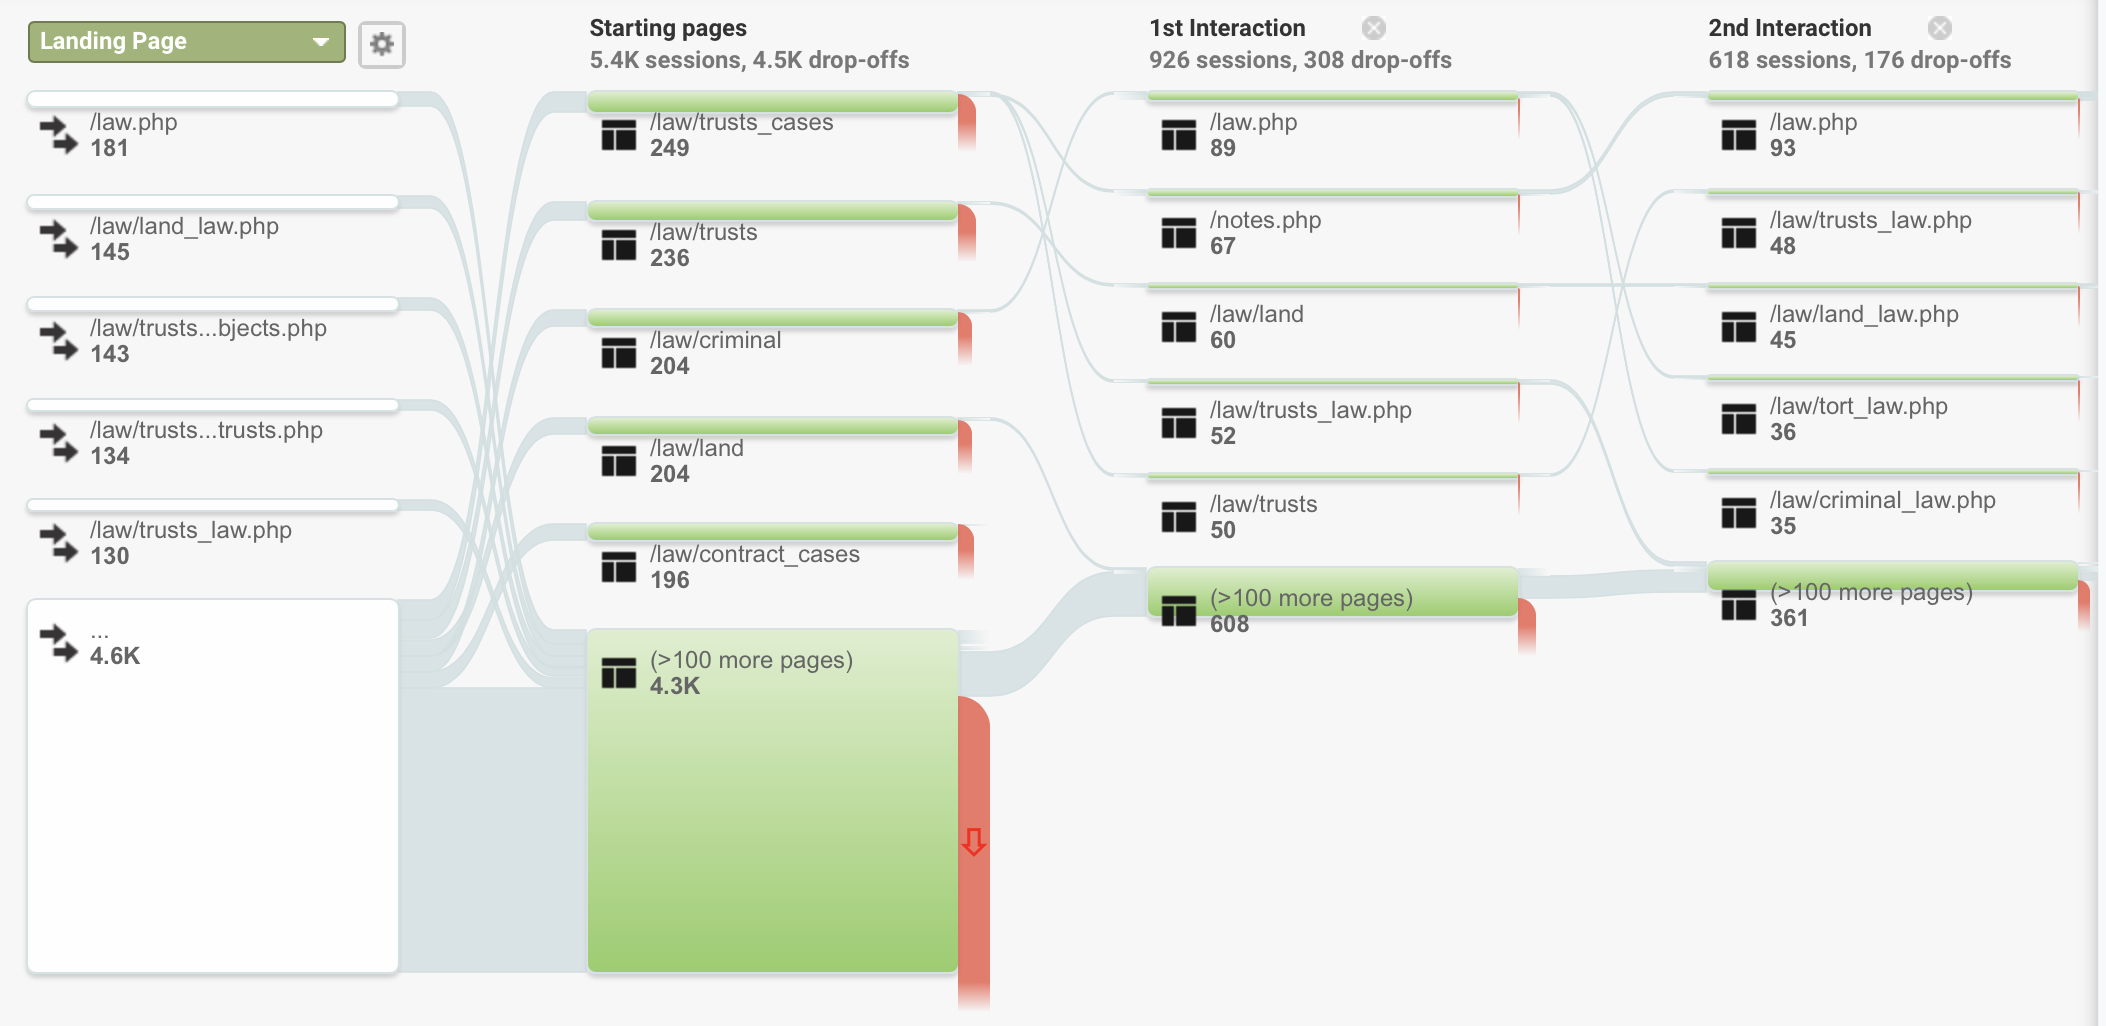
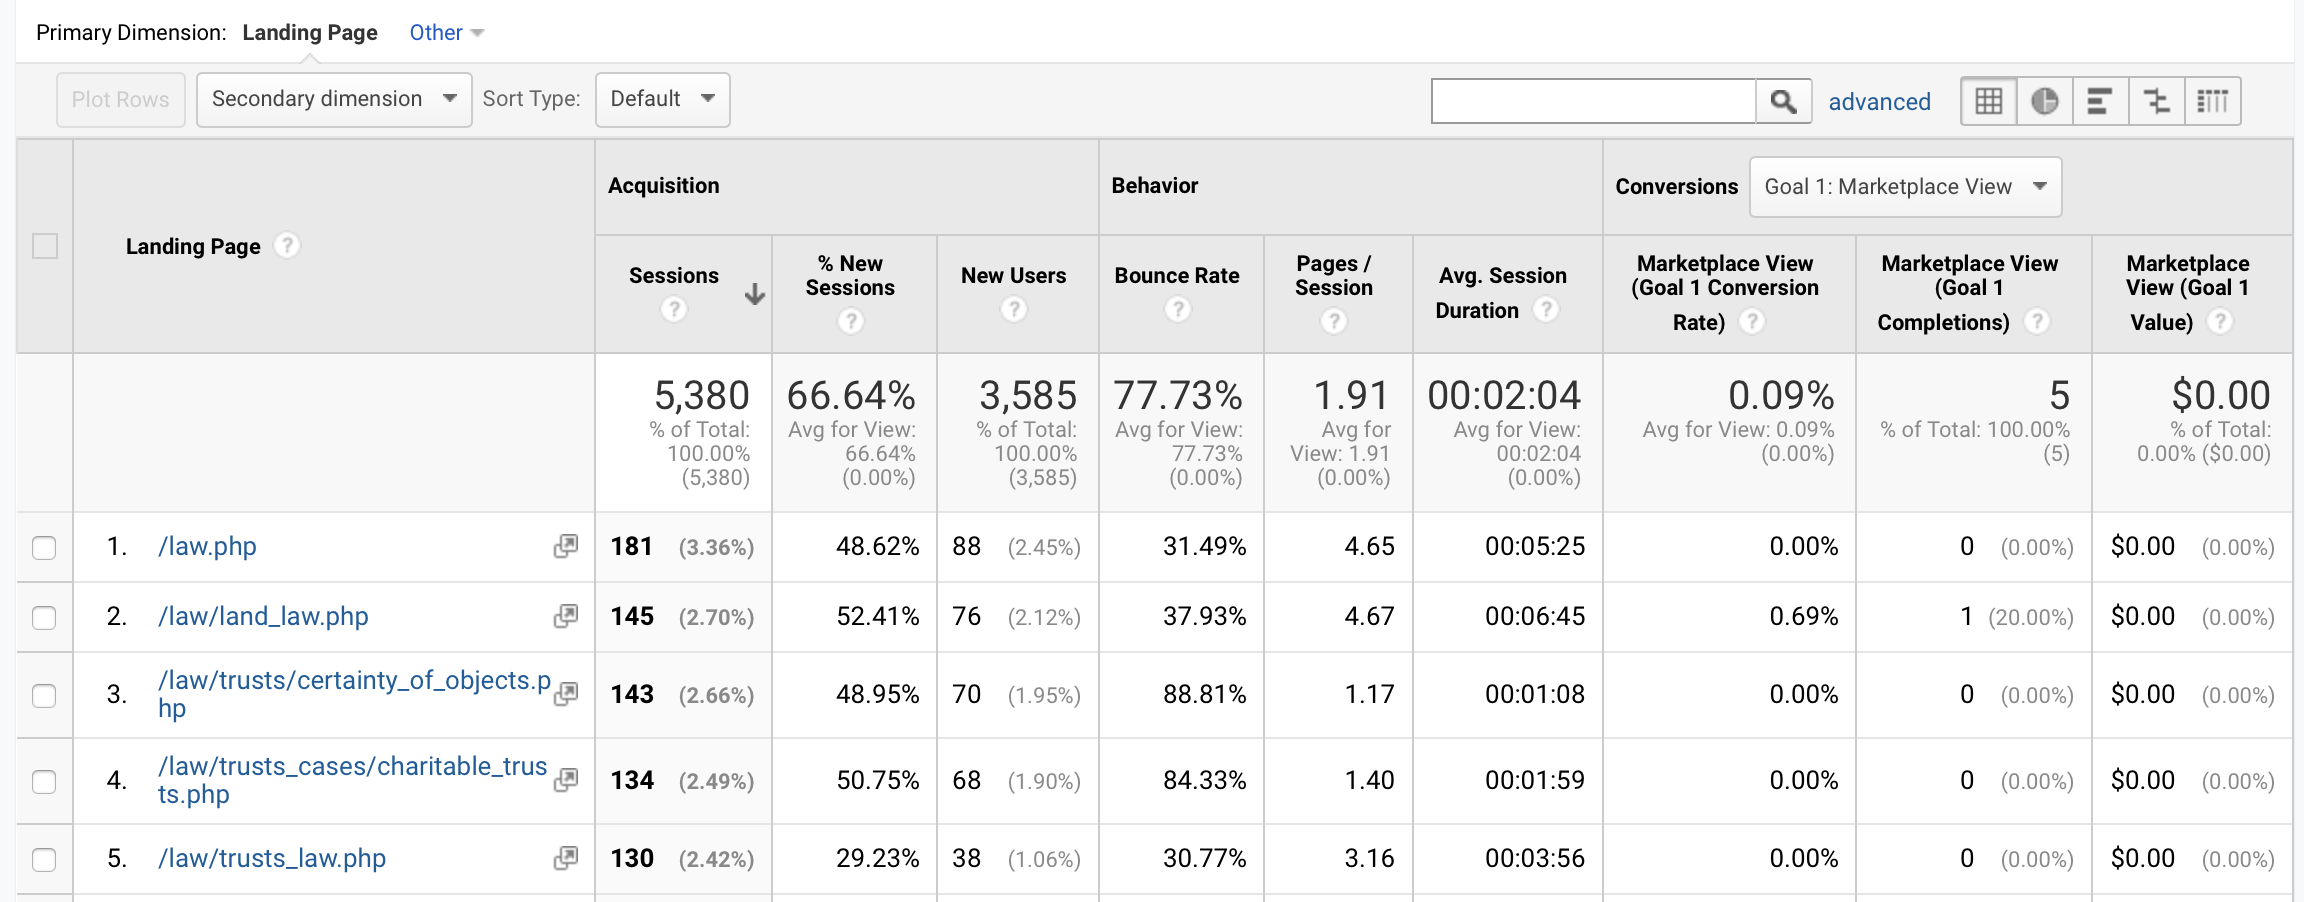
Landing Pages
In this section, we can access the specific information of each page on which website visitors have entered the site, including:
- Sessions: total number of visits per access page
- Percentage of new sessions: percentage of visits made by new users
- New users: total number of new users
- Bounce Rate: Percentage of sessions on a single page
- Pages / session: average page views in each session (visit)
- Average session duration: average visit time
- Conversions (in case you have set a goal)
Exit Pages
In this section, we can learn the pages from which your users have left your website.
If you have a blog or content site, often it will be the case that the landing page will match the exit page. It is very common for a user to do a specific search on Google or access an article from a social network that has caught their attention and, once the content is consumed, leave the site.
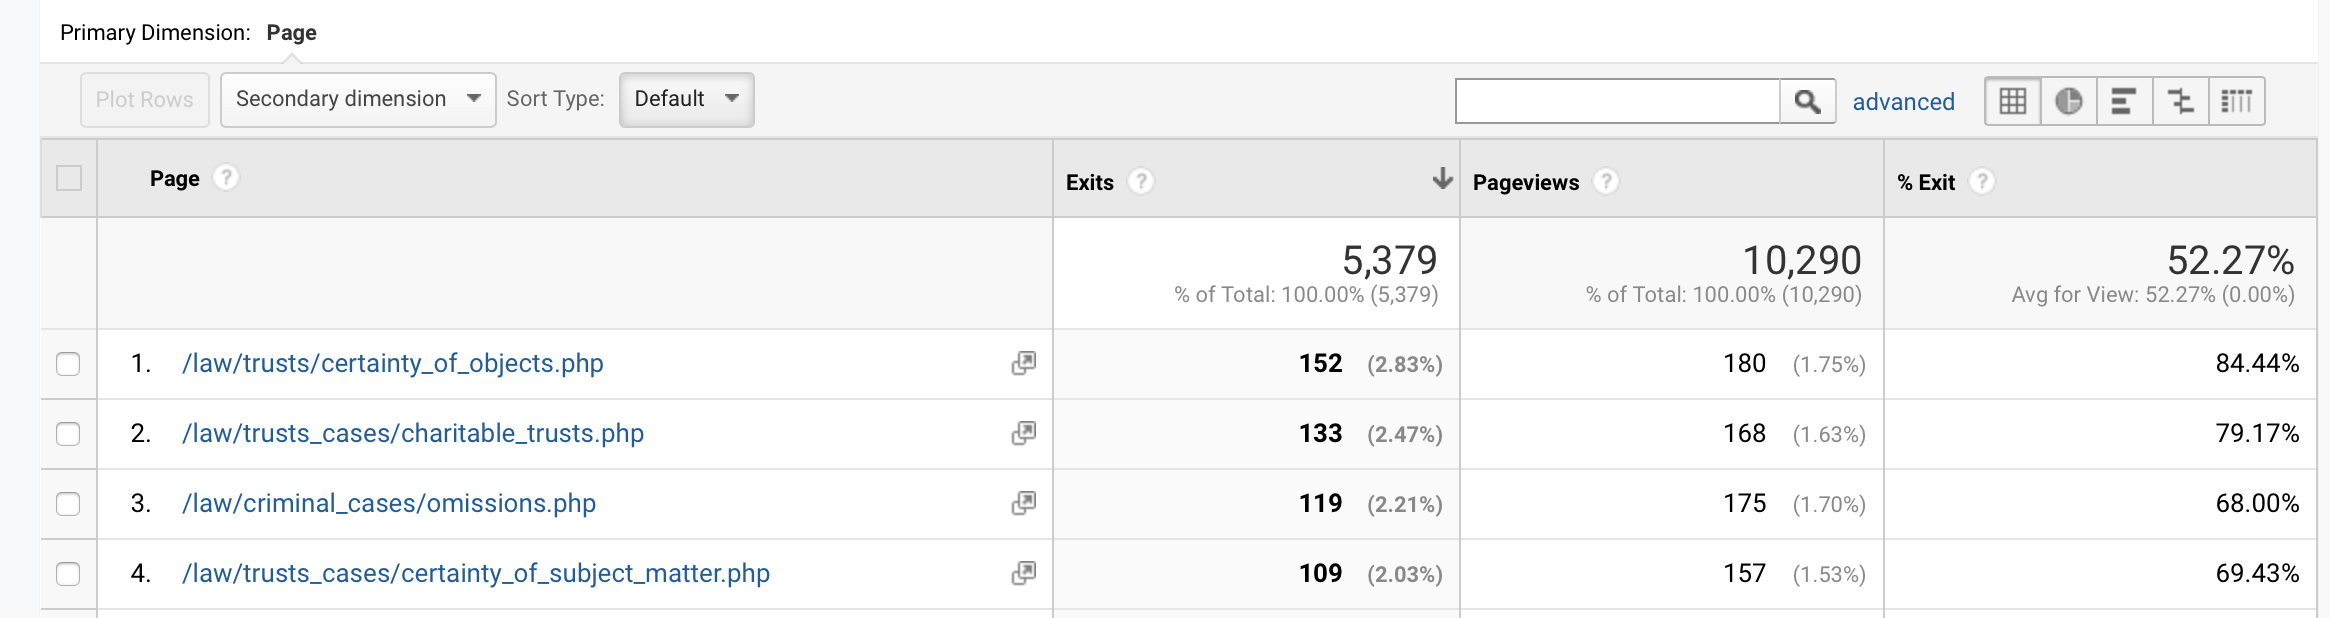
This is why internal linking is so important, to lead our users to other pages that may also interest them and continue on our website.
Site Speed
Ensuring webpages load fast is essential because it is something that will directly affect your traffic. If your website does not load quickly, many people won't bother waiting and will simply avoid your website altogether (or, at the very least, cause frustration!).
Although there are other more specialised tools to analyse the speed of a website, this Analytics report is quite useful because it tells you the average loading time of the pages of your website, assigns them a speed score and allows you to access recommendations to improve the loading time of each page.
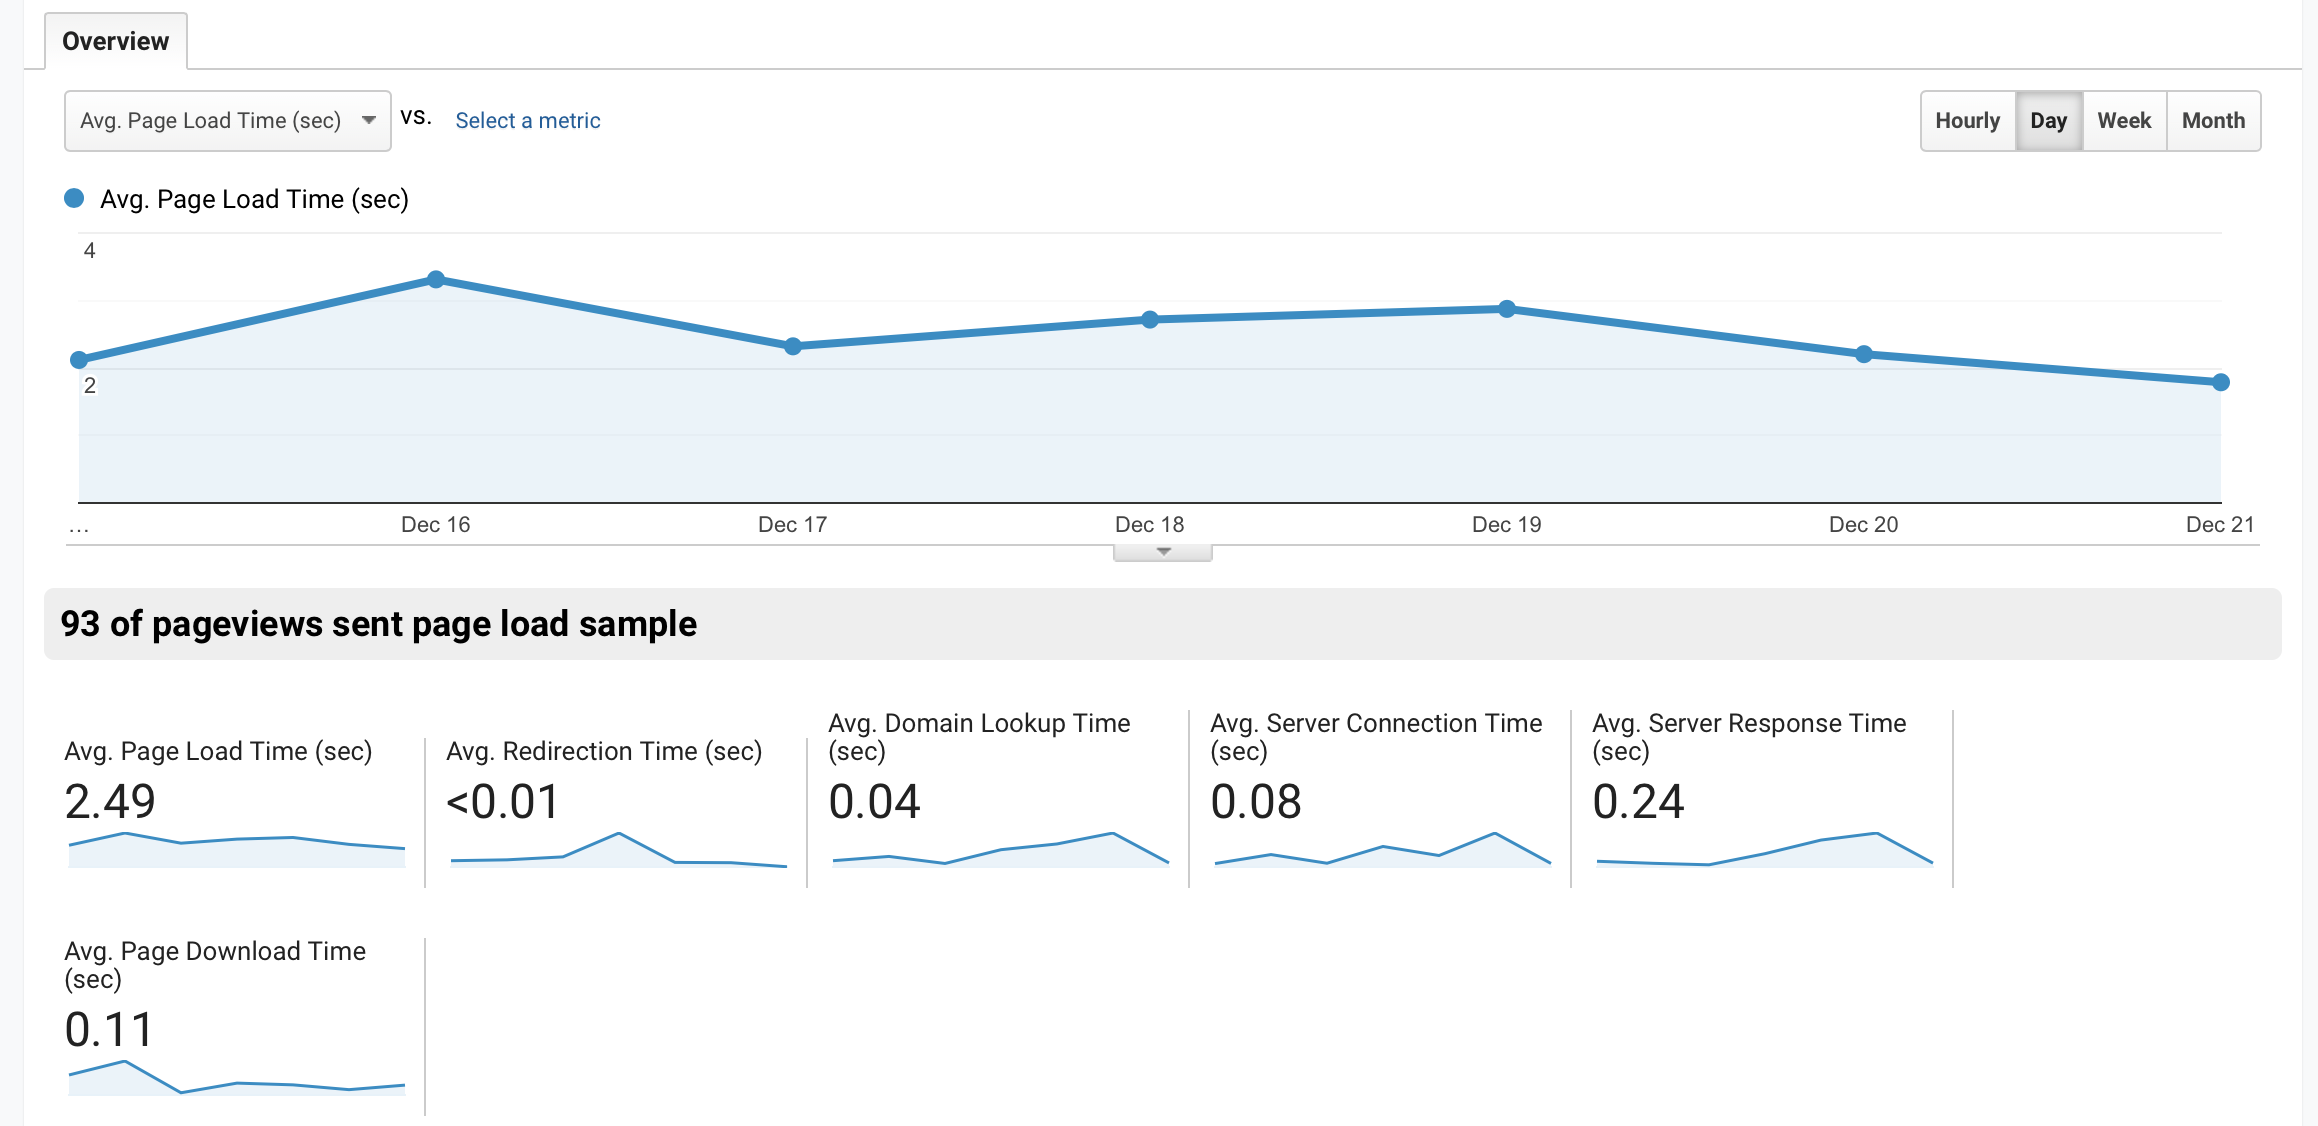
This section provides information on:
- The average page load time (in seconds)
- The average redirection time
- The average domain search time
- The average server connection time
- The average server response time
- The average download time of the page
In the 'Page Timings' section, we can access the comparative data of the loading time of all the URLs of our website in relation to the average loading time of our website.
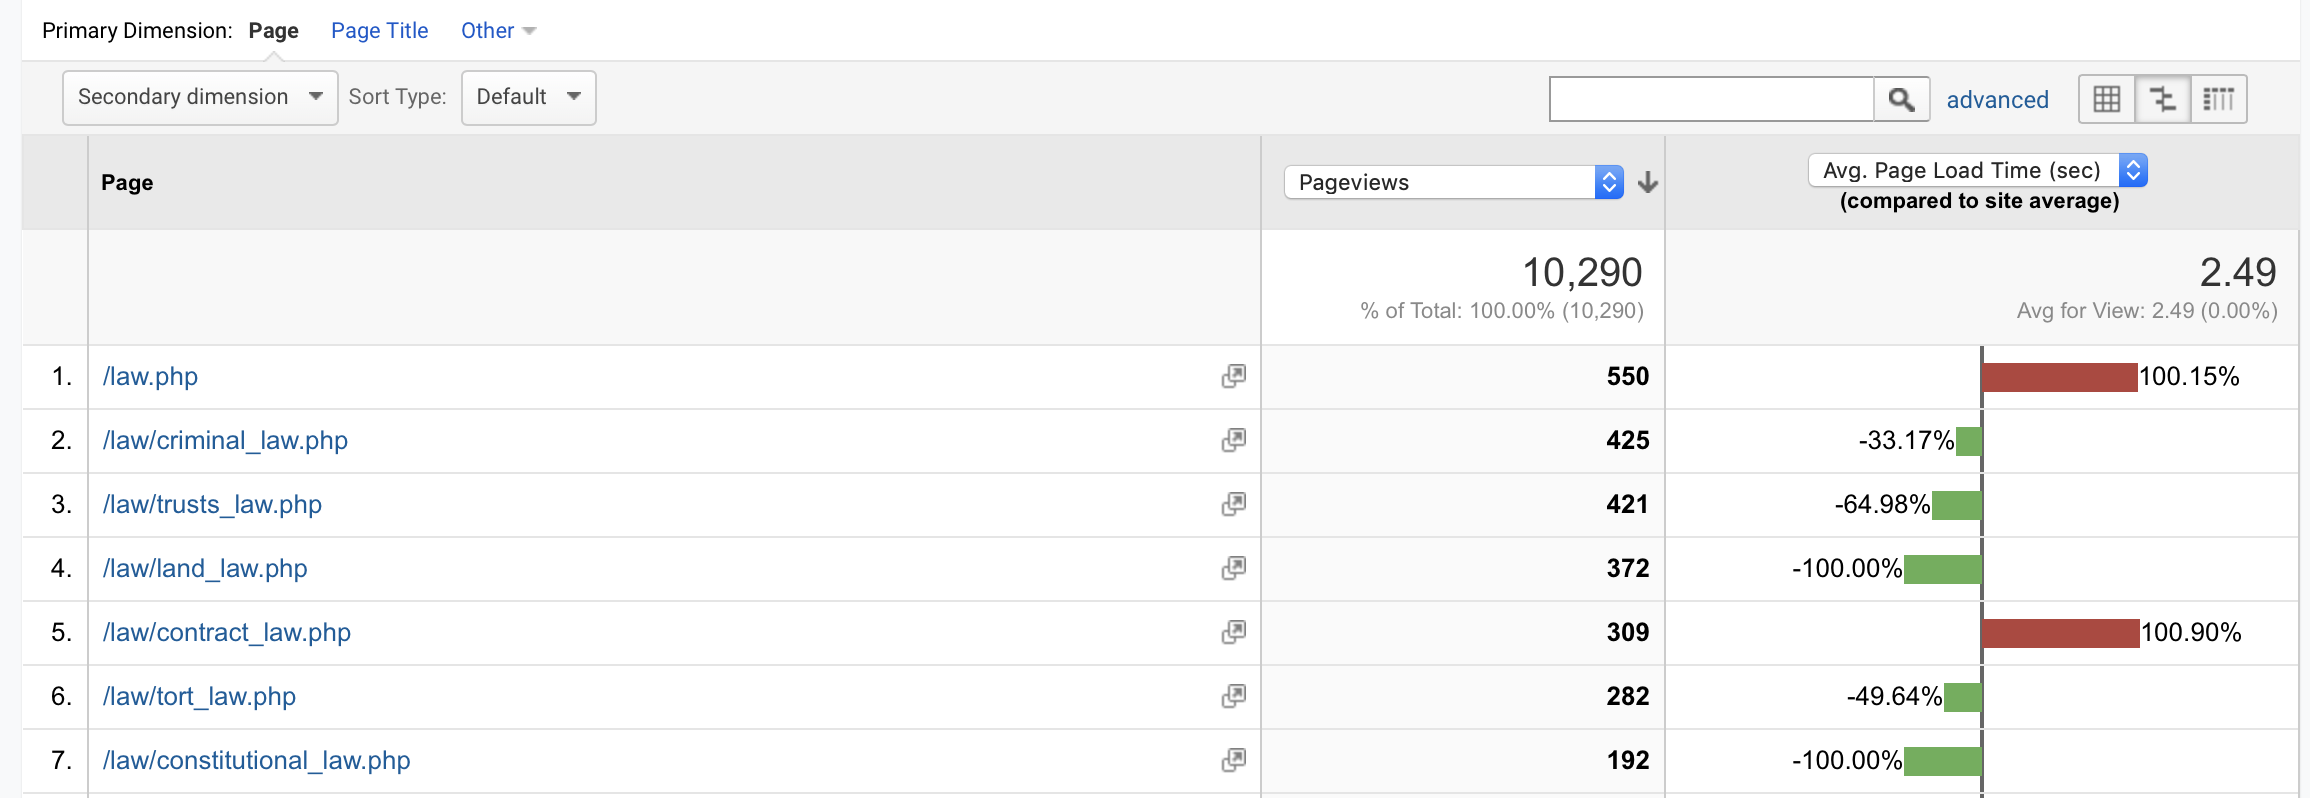
The 'Speed Suggestions' section is interesting because it shows us the loading time of each URL, makes suggestions for improving its speed and assigns a Page Speed score to each page (the higher this score is, the less margin there is for improvement).
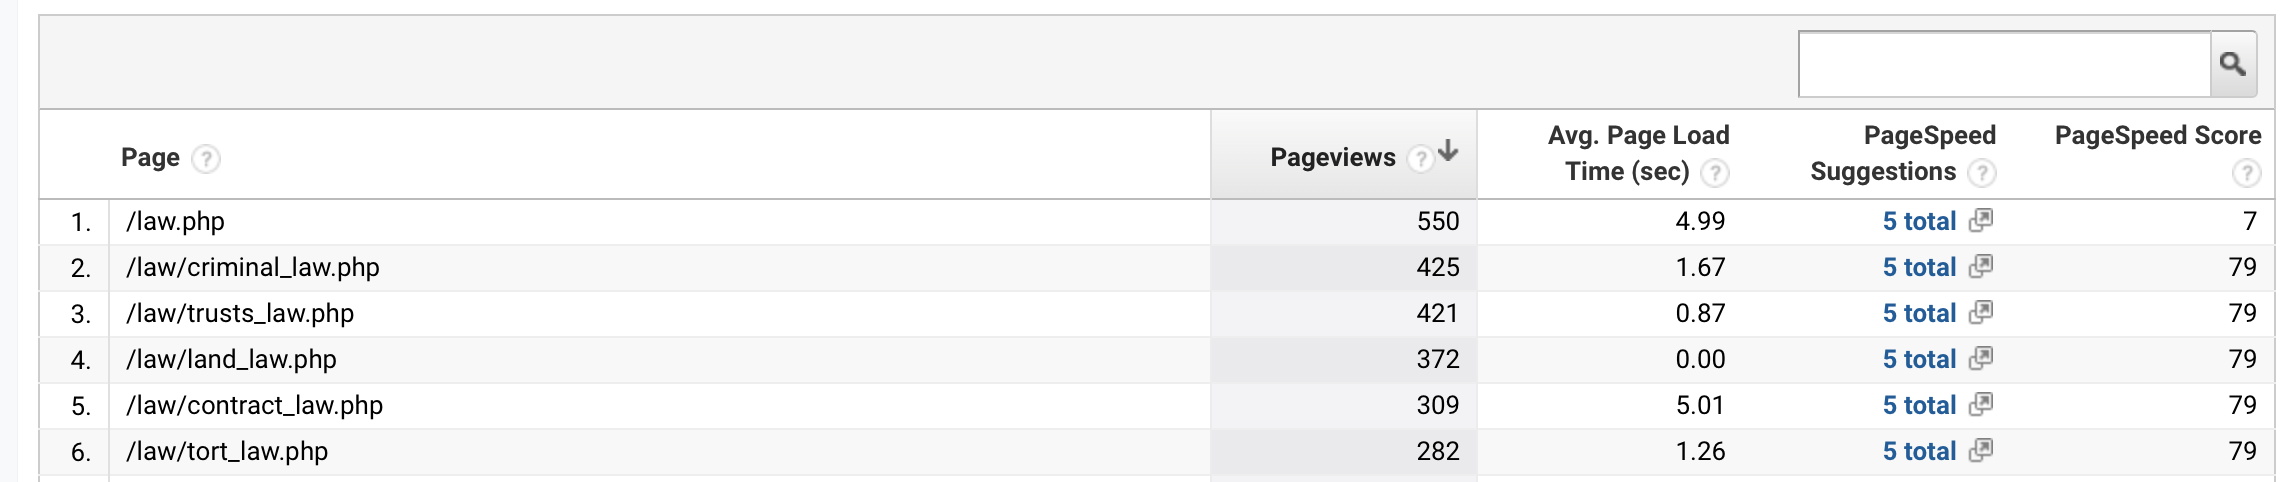
If we click on the page speed suggestions, it will directly access the PageSpeed Insight tool for you, which will perform an analysis of the URL in question. This analysis takes only a few seconds.
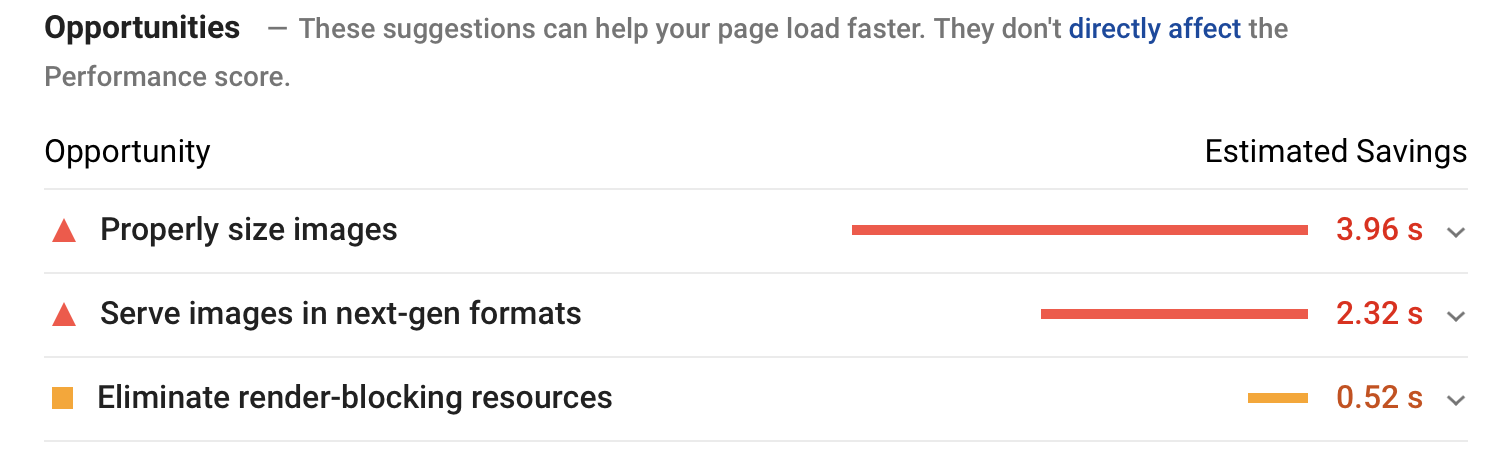
It will offer us a report of things we should or can improve, depending on their severity. These suggestions are indicated to us both for the desktop version of the page and for the mobile version too.
Site Search
This will only be useful if you have an internal search engine from which users can search and access other pages within your website.
If this is your case, the data that you can obtain in this section will give you more information about how your users behave and is useful to find out if you have your search engine optimised and pages optimised for your users' searches.
Specifically, in this section the tool will provide you with the following data about searches on your website:
- Number of sessions with searches
- Number of sessions with unique searches
- Average page views per search
- Percentage of visitors that have performed internal searches
- Terms that users have used to perform internal searches
- Pages through which your users have done internal searches
Events
Events are actions that users perform on our website but cannot be measured through the URLs as we do with traffic. Examples of events could be the download of an ebook or any other document, the download of an infographic or playing a video that we have embedded on our website.
In order to measure this series of actions, we have to create and label these events.
Once an event has been created and tagged, Google Analytics will be able to collect data and show it to us in a report.
I will be writing a blog post on this soon!
Conversions
It's good to know our traffic data, but it is much better to know if that traffic is working towards our goals.
Creating and Analysing Goals in Google Analytics
With Google Analytics we can configure a goal (or several) and know how it is performing in relation to the traffic we are receiving to our website. That is, we can measure and analyse the performance of our traffic.
What is the purpose of your website?
- If you have a blog, that goal could be to get subscribers for your mailing list
- If you have an e-commerce site, that goal will be related to transactions (sales)
- If you have a service based business, that goal could be to get new work requests
Whatever your goal, in Google Analytics you can configure and measure it. You can create up to 20 different goals.
To do this, from the Admin menu on the left sidebar, access "Goals" in the third column:
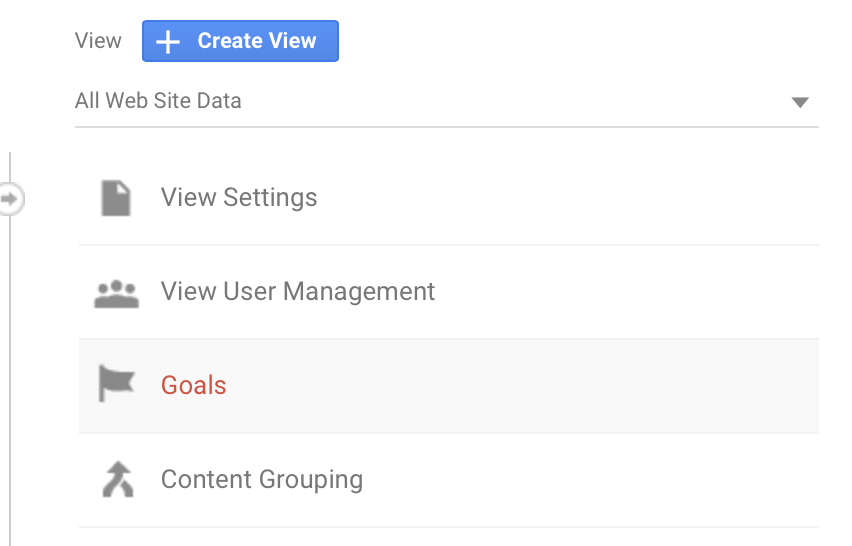
Click on 'New Goal'.
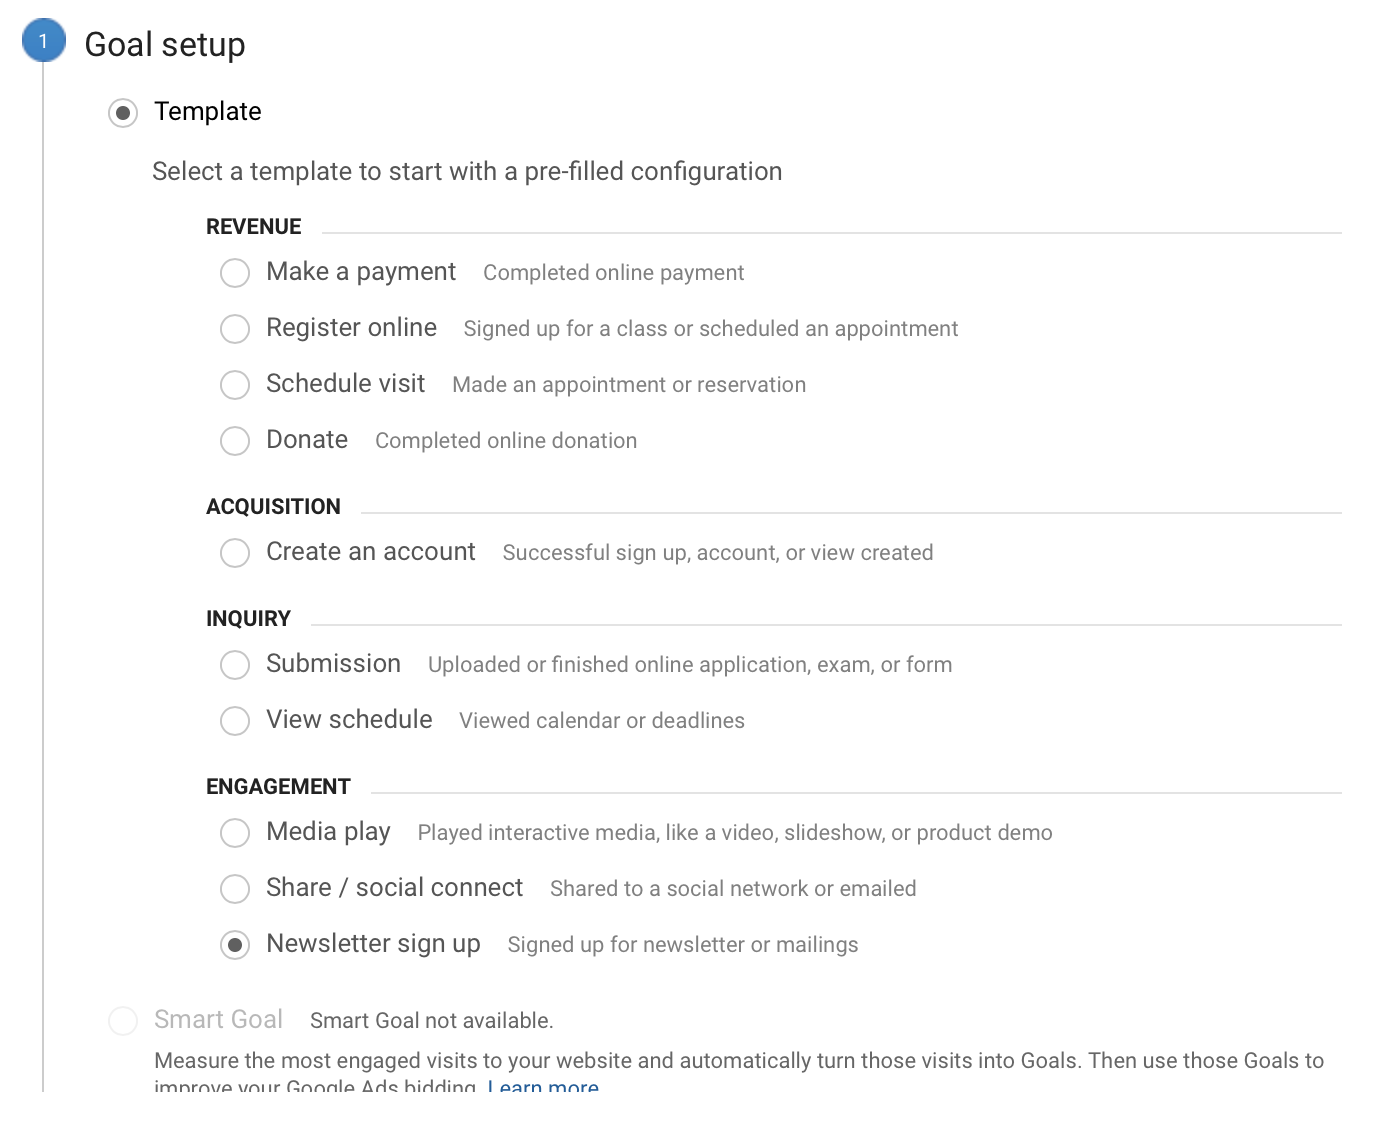
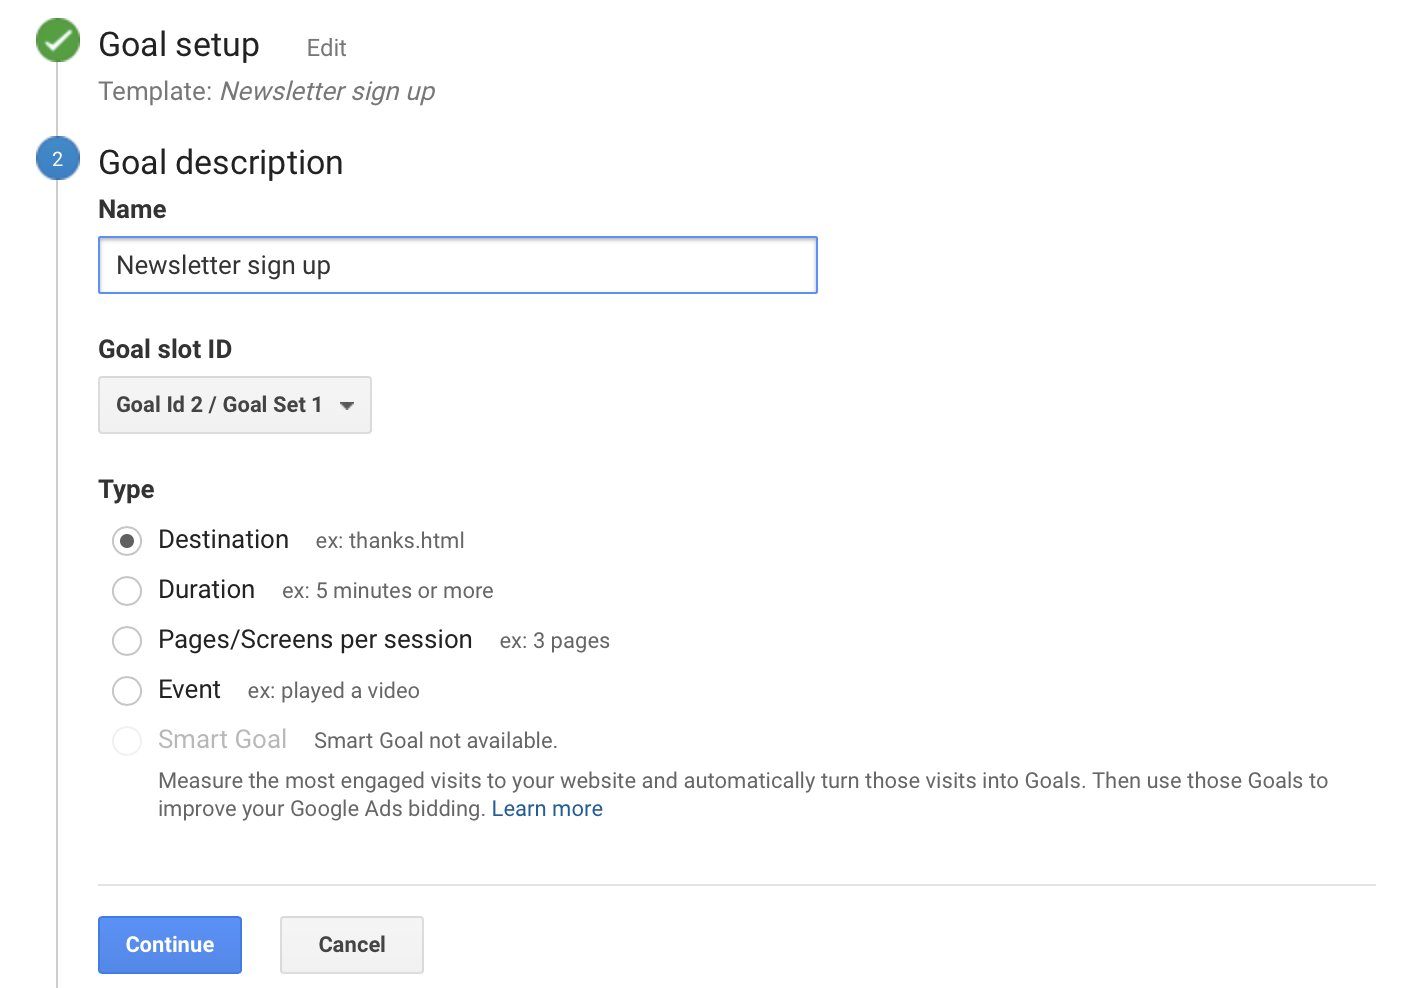
The first step will be to configure this goal. To do this, you can directly select any of the options provided by Analytics in your goal template, or choose a custom configuration.
We are going to select a given goal of receiving newsletter sign ups in this example:
The next step is to describe the goal. To do this, we will give our goal a name.
The last step is goal information. Here we will determine the destination URL by which the objective will be measured.
In this case, we will indicate that this page is the “thank you for signing up” page, since it is where users who have completed the sign up form will land.
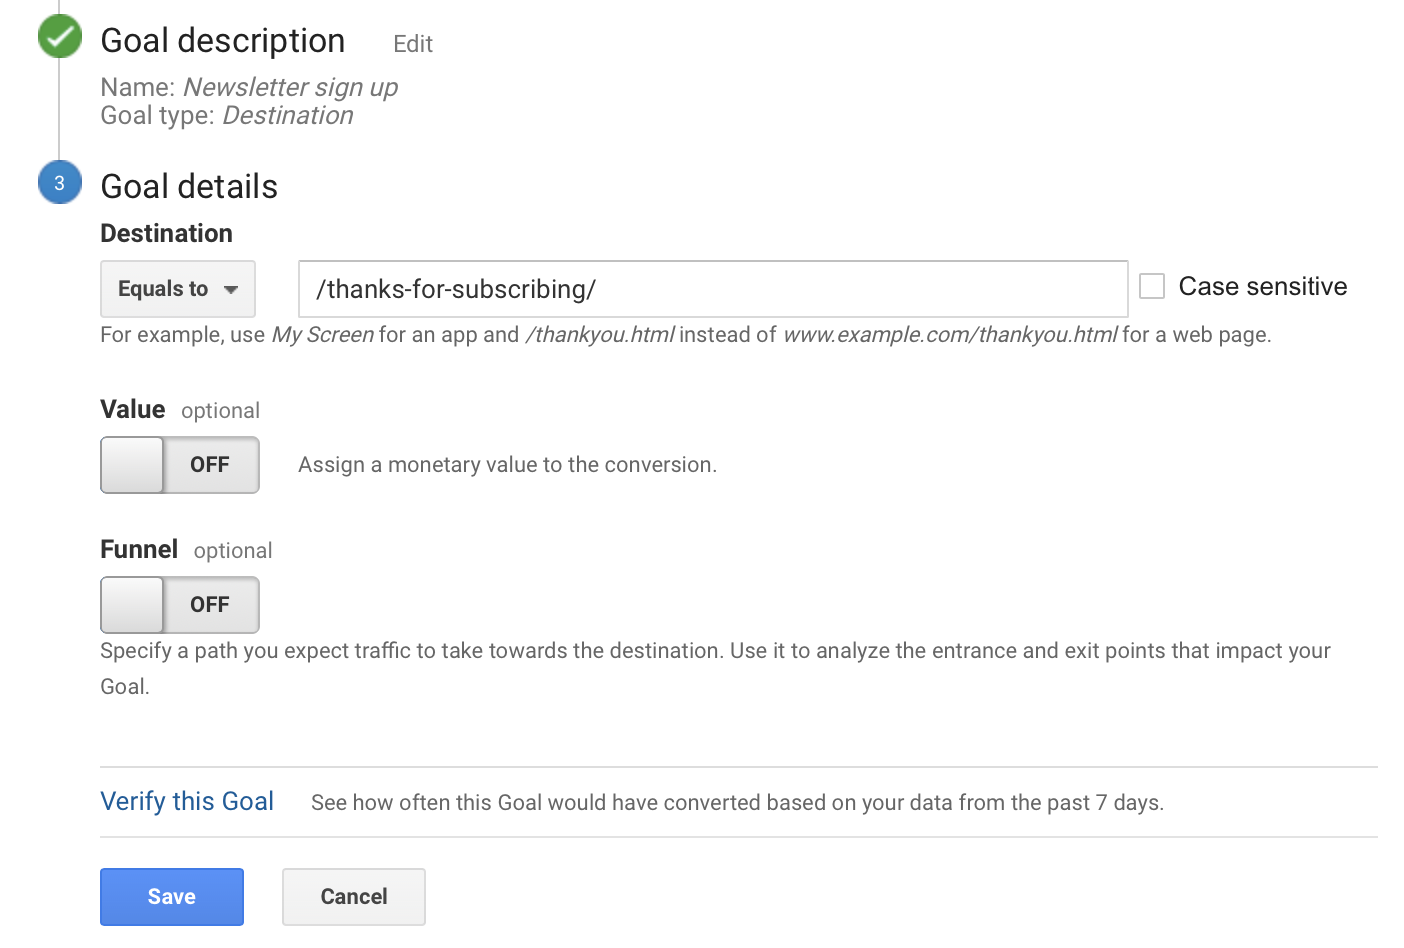
In this section, you also have the option of assigning an economic value to your goal and establishing a funnel to set the route that your users should follow until they reach the established landing page. In this way, you can analyse the entry and exit points that affect your goal.
Once you create, configure and verify your goal, Google Analytics can start collecting data.
From there, in the Overview panel in the Conversion section, you will see all the information of the goals achieved, the value of the goal (if we have assigned it), the percentage of conversions of the goal and the percentage of dropouts.
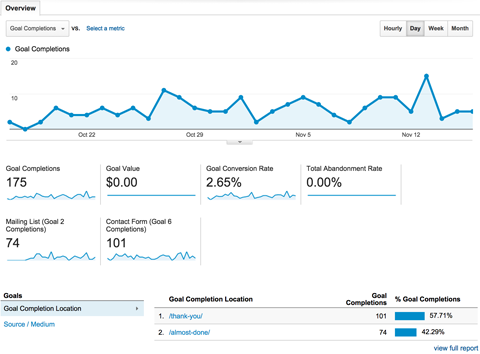
In the URL section of the goal it will show us the data of the goals met by each established landing page.Here you can see the number of goals completed and the percentage of successful completions.
Conclusion
So there you have it, the complete breakdown of Google Analytics. I will be going in more depth, where necessary, to help those who want to become true professionals. But, this is a really helpful guide for those that want to start using this powerful tool properly.
If you like this content you’re going to love everything else I do. I want to provide you with unbelievable value so you, too, can achieve all your business goals. Let me know what you think of this post and I'd be happy to help any of you guys who may be struggling with your own marketing strategies. Also check me out on Instagram, YouTube, and Facebook.
Currently there are no comments, so be the first!